PageSpeed Insights and GTmetrix are measurement tools for your website that can help identify and improve the performance of your website. We are going to describe each tool, how they work, and their differences. Our goal is to explain each tool and then recommend when to use one tool over the other.
Website Performance Measurement Tools
Each of the website performance tools analyzes your website to determine a number of metrics that give you an understanding of how your website is performing.
Website performance tools also provide recommendations that are used to help improve your site. For example, if your site has something that is causing it to be slow, then the performance tool will often flag it for you to improve.
Here’s an example of how PageSpeed shows its results: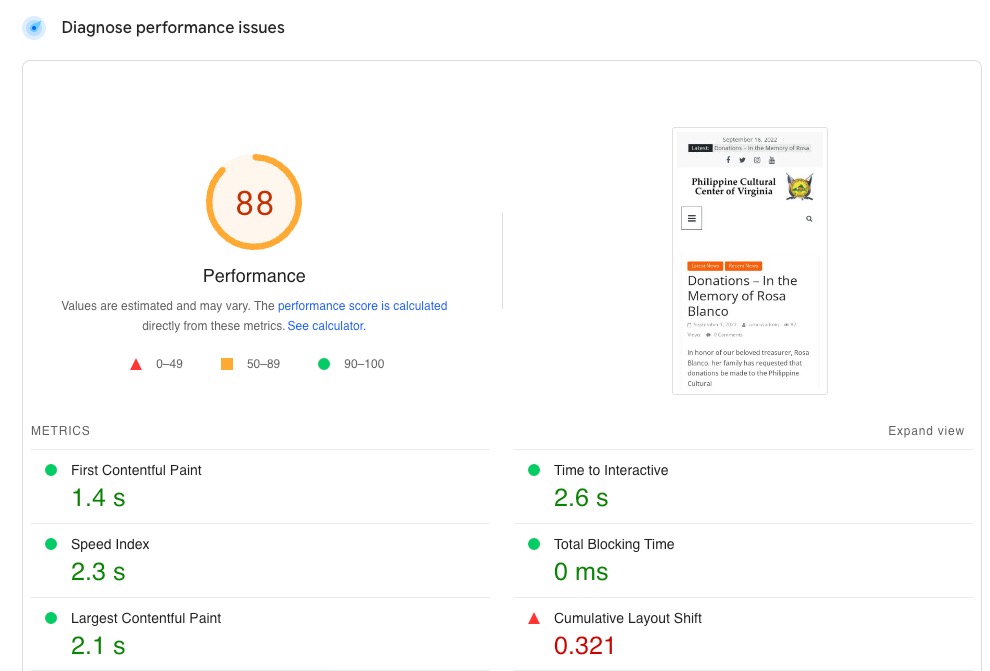
Surprisingly, both tools (PageSpeed Insights and GTmetrix) use the same technology to evaluate a website’s performance – Lighthouse. Google defines Lighthouse as:
Lighthouse is an open-source, automated tool for improving the quality of web pages. You can run it on a web page, public or requiring authentication. It has audits for performance, accessibility, progressive web apps, SEO, and more.
Each tool uses Lighthouse to test the site and additional methods that are used to provide a score. Both PageSpeed and GTMetrix provide two scores, but they are different. Each tool may seem to provide the same information, but there are major differences in how the scores are generated by each service.
PageSpeed Insights
This tool is Google’s performance tool and is free to use. Google tests your website by running it through the Lighthouse application with simulated environments and using real-world data. Real-world data is gathered through CrUX (Chrome User Experience) data if it is available for that website. PageSpeed Insights gives two scores – one for mobile and the other for desktop.
PageSpeed Insights analyzes a site using the following metrics:
| Metric | Description | Weight |
|---|---|---|
| First Contentful Paint | Time measure from when pages starts loading to when any part of the page’s content is rendered to the screen. | 10% |
| Speed Index | Measures the speed at which content is displayed during the page load. | 25% |
| Largest Contentful Paint | The render time of the largest image or text block of the displayed portion of the page relative to when the page first started loading | 25% |
| Time to Interactive | The time it takes for a page to become fully interactive. | 10% |
| Total Blocking Time | This is the time measured between the First Contentful Paint and the Time to Interactive. | 30% |
| Cumulative Layout Shift | Measures the visual stability of a leading web page. Layout shifts occur when a change suddenly occurs on the page, with no warning. | 15% |
Although Google does not publish where its test servers are located, posts in the Google communities forums indicate that the PageSpeed appears to be more oriented towards the US. Keep in mind that Google continues to update its services, so do not be surprised if testing becomes more available to websites around the world.
When you run PageSpeed Insights, you will be able to bring up the Lighthouse Scoring Calculator. This tells you the value, metric score, and weighting of each metric that is used to provide the overall score. Here’s an example of that page:
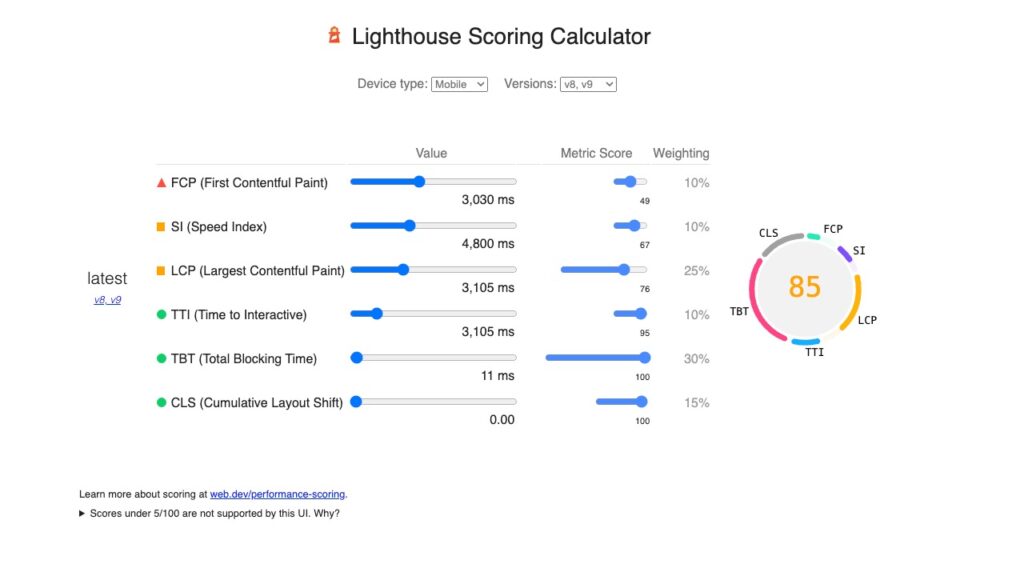
So what does this score mean? The Google PageSpeed Index (PSI) score is based on several scores taken from various tests that run in a simulated environment. It may also involve real-world data if that data is available for the website being measured.
The screenshot of the scoring calculator (above) also shows you the weighting of each metric and how it contributes to the overall score.
It is important to understand how PageSpeed generates the score using Lighthouse. PageSpeed Insights creates a score based on both lab and field data. The lab data is based on simulations, but the field data is based on data collected from real-world user experience.
In some cases, there may not be enough data on a newly published website. This will be indicated at the top of the report when you run it in PSI. It will say, “Discover what your real users are experiencing – No Data.” If there is data for the website, then it will be displayed like this:

The best thing about the generated score is that it provides recommendations in the opportunities and diagnostic section of the report. Here’s an example of one:
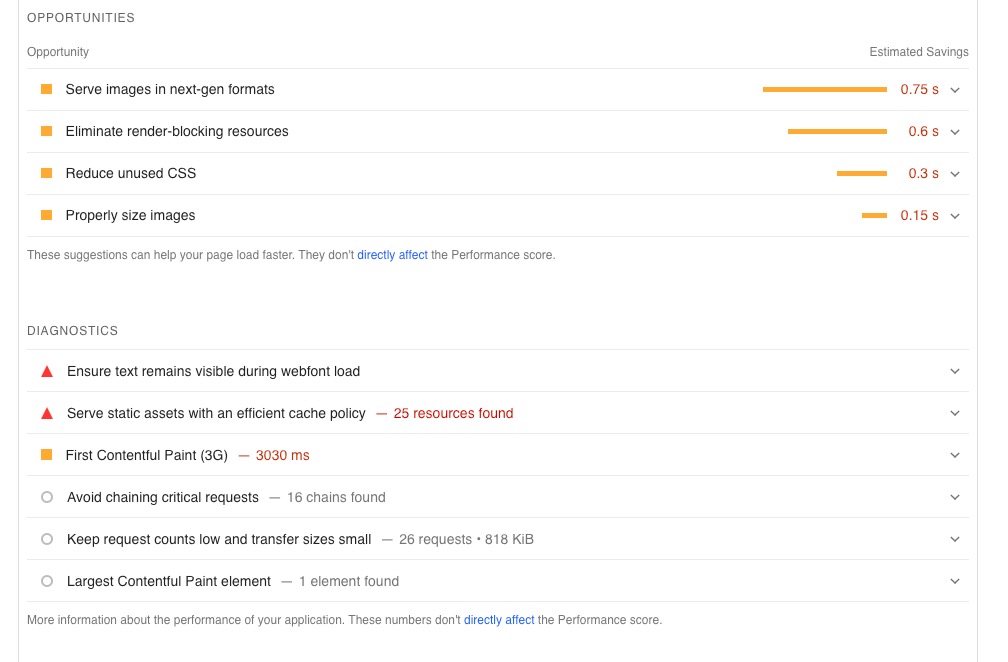
You can use this report to improve on the areas of your site that can directly improve your PSI score. Improving these areas of concern will also contribute to improving your overall search engine position.
GTmetrix
GTMetrix is another online tool that can be used to measure the performance of your website. It is free to use, but it also provides paid plans that begin at around $11 per month. The different plans allow you several options that include:
- Monitored slots – ability to monitor different pages of a website
- Weekly On-demand tests -option to add weekly tests
- Data Retention – History of performance tests and monitoring
- Hourly monitoring – scheduled monitoring
- Premium Test Locations – access to 15 premium global test locations
- Mobile Device Testing – allows for testing on different specific mobile devices
The old version of GTMetrix (before January 2022) used the results from Google’s PageSpeed Insights and Yahoo’s YSlow applications. The current version uses Lighthouse to provide the GTmetrix grade including Performance and Structure scores.
Here’s an example of a GTMetrix report on a website:
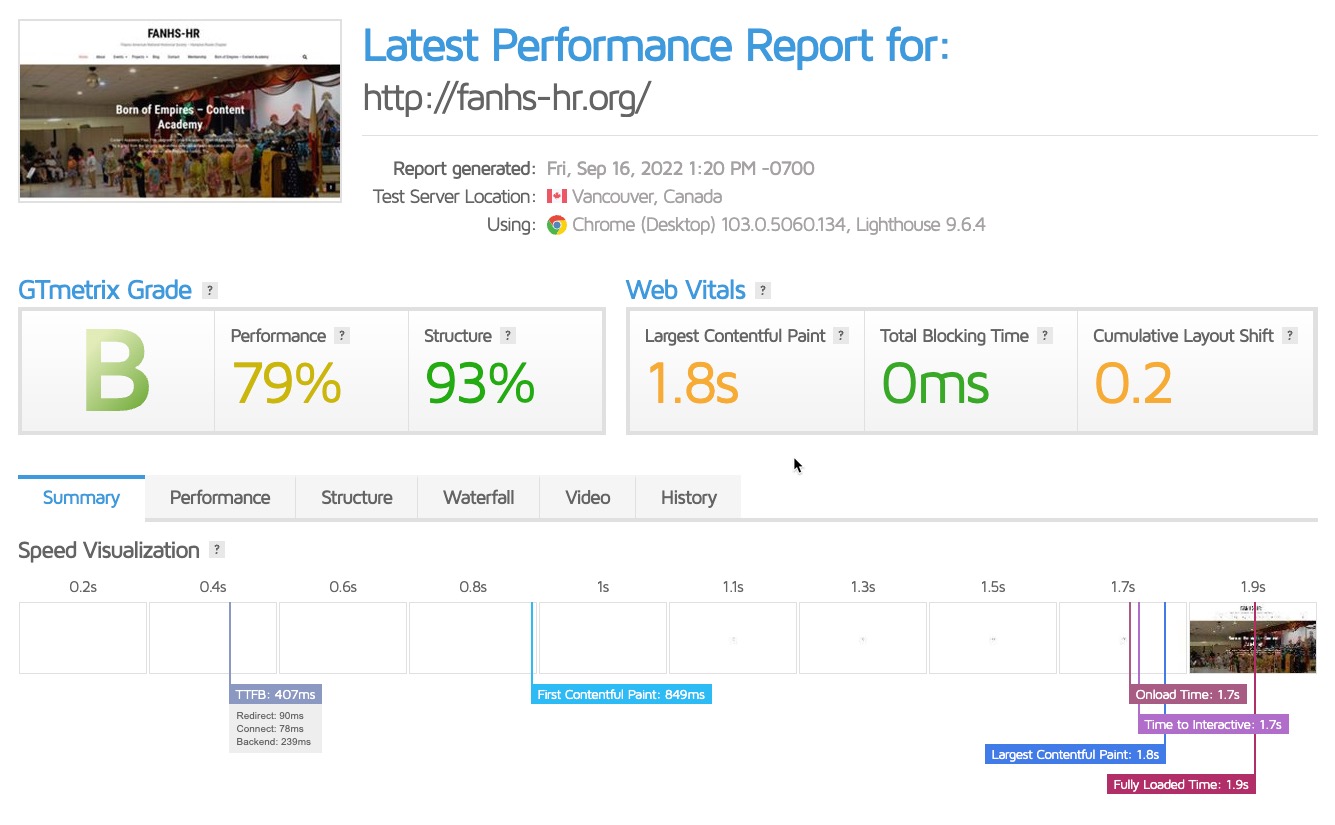
GTmetrix uses Lighthouse as a foundation to get the same performance metrics used by PageSpeed Insights. These metrics include:
- First Contentful Paint
- Speed Index
- Largest Contentful Paint
- Time to Interactive
- Total Blocking Time
- Cumulative Layout Shift
It also provides a score based on the structure of the website. So, you’ll see a letter grade, then two scores.
There is a major difference in how the tests are run. GTmetrix uses an actual internet browser loading the web page. It also does not use Lantern – an algorithm developed for Lighthouse in order simulate load-behavior.
The “simulated mode” used by Lantern then uses CPU or resource throttling in order to measure against different conditions such as slower CPU, less memory, slower network connects, etc.
GTmetrix uses a method called “observed mode.” This means that the testing is occurring on a specific device and connection and does not use the gathered data to simulate other conditions.
Additionally, with the paid and registered options in GTmetrix, you can change the test location and mobile devices used in testing. Being able to test from a server geographically nearer to your location will produce more realistic results for you.
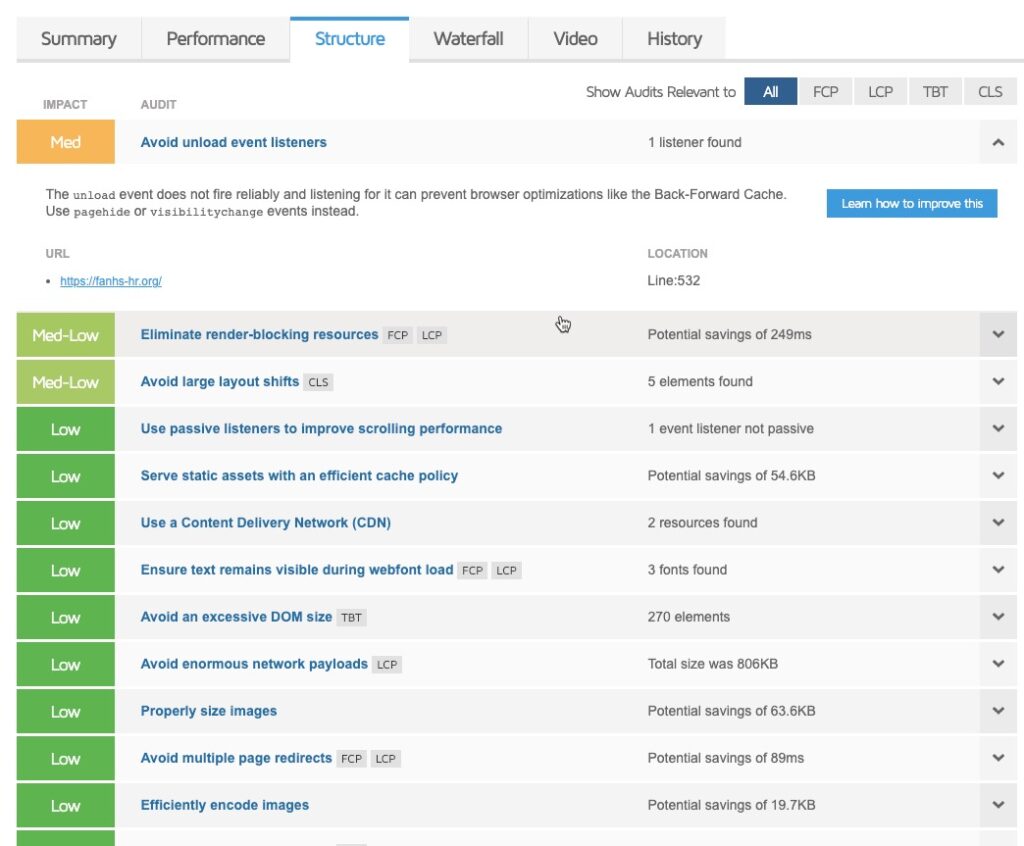
Like PageSpeed Insights, GTmetrix also produces suggestions that will help to improve your site’s performance. You can find them in the Structure tab of your results. Here’s an example of what it may look like:
Which Tool Should You Use?
Now that you have a good understanding of Google PageSpeed Insights and GTmetrix, how do you decide on which tool you should use? Both use Lighthouse API as the core method of obtaining metrics on your website. However, one uses a simulated mode, while the other is customizable with its test locations.
Case Study – PageSpeed vs. GTMetrix – Apple.com
Using each tool, we looked to see the difference in the tests and how the results for mobile versus desktop would impact the scoring. This comparison uses a website based in the West Coast of the United States – Apple.com.
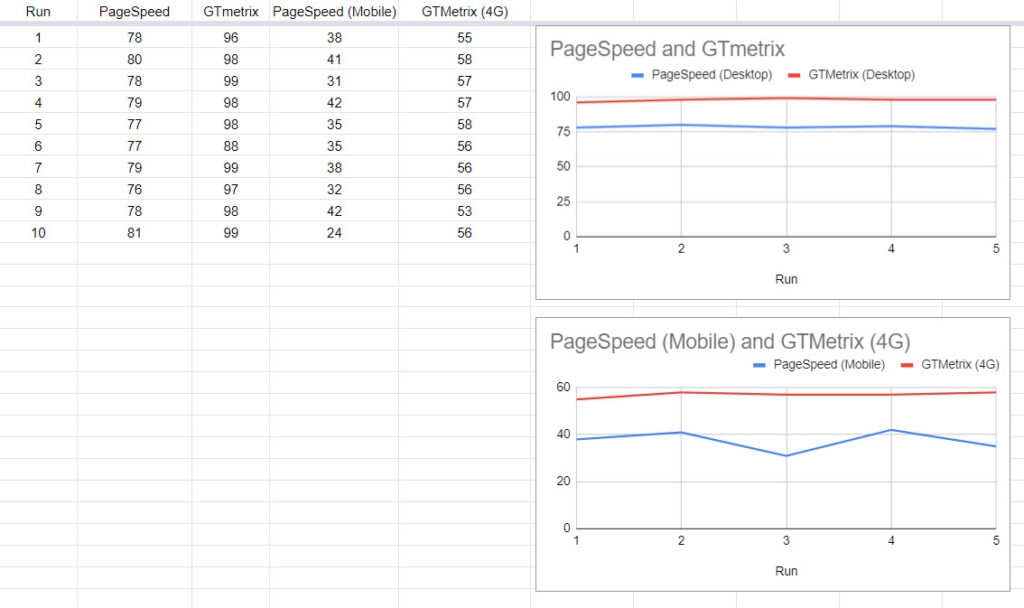
These results show that Google is far stricter with its emphasis on mobile first websites versus GTMetrix which is using a general mobile device 4G network to run the test comparison. This shows in the lower scores for mobile tests in PageSpeed. The test does indicate that the desktop test of the site is significantly better than the mobile test in either tool. Results are fairly consistent for each of the tests, with the widest variation occurring in the PageSpeed graph using mobile.
PageSpeed Insights can test (through simulations) many types of conditions that you will not always be able to select in GTmetrix. However, it cannot be customized for your purposes or location. Due to the variety of test conditions and results that are used to give you a score, PageSpeed is often recommended when you’re working to improve your website’s SEO.
GTmetrix results can be modified to include the capture of data over a length of time, and the test location can be changed to suit a foreign-hosted website. Customization options also allow you to select a specific mobile device.
GTmetrix is a good solution for a performance measurement tool when you are located close to a GTmetrix test server location. You may also find it better if you need to check performance on a specific mobile device or you need to record test results captured over a period of time. If those conditions match your needs, then GTmetrix may prove to be a more accurate solution.
In summary, both of these performance tools are good for grading your website. PageSpeed Insights is free and its results are best for SEO because of how its metrics are generated. The paid version of GTmetrix can give you a closer idea of overall website performance based on the customization options that you have selected.