In our Ultimate Guide to High Performance WordPress for High Traffic Sites, we will show you how to identify and fix common performance issues with WordPress and the server it’s hosted on. Our guide combines over 20 years of experience of fine-tuning servers, CDNs, and website code to deliver high performance WordPress sites. If you’re currently experiencing subpar performance and need to speed up your WordPress site, then you’ll find all your answers in this ultimate guide.
Table of Contents:
- Executive Summary
- Setting Your Performance Goals
- Speed and Performance Indicators
- Understanding a Website Request
- Server Configuration & Tuning for WordPress
- Caching Explained with Implementation Techniques
- Optimizing the WordPress Application
- Server Monitoring & Adjusting Performance
- Monitoring Regimen for Continuous Performance
- Memory Usage on the Server
- Adjusting Database Buffers
- Managing FPM/OPcache Memory Consumption
- Caching Statistics Review
- Application and Server Caching Statistics
- Periodic Performance Testing
- Google Analytics for User and Page Experience
- Uptime Monitoring
- Adjusting Based on Monitoring Results
- Experience High-Performance WordPress
- About the Authors
Executive Summary
This guide addresses 3 key areas and includes the background knowledge to extend the core recommendations to your specific use cases. This Executive Summary covers the most impactful in order of ease. The complete guide is recommended for teams responsible for business critical websites that need to perform at the highest levels.
Server Type and Configurations
It is generally best to run a high performance WordPress on a standalone server. If you will be running it with a management system, like cPanel, or other services like email, you should use a server that has sufficient resources for WordPress plus the other systems. Review your current hosting for what it offers and aim for higher resource specifications and then work down. Trying to save $20/month in hosting fees can cost you significant time and resources trying to Band-Aid your current system. Don’t fall into that trap if you are running a high traffic WordPress site that needs to perform under stress.
- 4vCPU/4GB RAM on NVMe storage as a minimum for a standalone server
- 8vCPU/8GB RAM on NVMe storage as a minimum for WP + cPanel/other services
Additional CPUs are recommended for throughput and resilience. Large amounts of RAM allow for aggressive caching strategies for speed and for resilience at high request levels.
The following server stack is recommended with the following base configurations:
- PHP 8.0+ with PHP-FPM with 20+ Workers
- Opcache On with a pool minimum of 128MB RAM. Keep your
opcache_hit_rateclose to 100% by increasing the pool as needed. - Use Redis with a high
maxmemorysetting. Minimum of 256MB of RAM. Avoid key eviction if possible by setting the memory directive higher, and set the eviction policy toallkeys-lru, or Least Recently Used. - Optimize your MariaDB with a large
innodb_buffer_pool_sizeusing the values provided in our RAM Allocation Table to start. Enable query caching. Monitor for temp table creation and modify to avoid creating temp tables on disk. Prune your WP database of old nonessential data like auto-saved drafts, comment spam, and transients. Perform Audits and tune your settings. - Use NGINX + Apache for the web server and use Brotli, gZip, and HTTP/2
Please see the Server Configuration & Tuning for WordPress section for complete details. Once running, follow the Server Monitoring Recommendations to validate your initial setup.
CDN Decisions
Utilize a CDN to increase both end user performance and increase your website’s resilience at high request levels. The following is recommended:
- Use a reasonable cost CDN. As you might imagine, free CDNs, including Cloudflare, do not prioritize your website over their busy, paying clients. Bunny.net is an example of a CDN that charges a more than reasonable cost but also then keeps your website properly cached. CDN is not free and required for performance.
- Utilize TTLs and E-Tags to keep browsers and CDNs from going to your origin server without reason.
- Use Full Site Delivery, aka Full Site Acceleration. Caching static files is the typical approach but though straightforward, does not deliver the performance or resiliency levels needed.
- Full Site Delivery means your complete site is served by the CDN and dynamic content can now be optionally cached by the CDN according to your page rules.
- Cache “Tolerant Dynamic Content” for set time periods. This is content that is informative for a visitor but will not be harmed by being cached for short periods of time. Think from 2 minutes to 10 minutes.
- Use a WP plugin to control Caching so writers publishing new Page or Posts do not need to worry about cache busting. We recommend Total Cache, but most popular Caching plugins can properly clear most popular CDNs.
A quick followup for Full Site Acceleration as it is quite a bit of work to get right, but the reason is simple and as follows. Serving a cached version of your homepage from Points of Presence (PoPs) to 1,000 visitors in 5 minutes from edge servers geographically closest to them is much, much easier and much, much faster than having all 1,000 visitors descend the origin stack to just get the exact same page.
Optimizing Your WordPress Site
After selecting a proper server with a solid stack and adding full site accelerated CDN, you are now going to be digging into your WordPress. Some of these steps require the above systems and some are only in WordPress. The recommendations:
- Page Caching in a full site delivery setup CDN. This is a repeat of the Full Site Delivery and caching Tolerant Dynamic Content above.
- Use Redis for Object Caching in your WP. Use Total Cache or some other WP plugin that handles connecting and using Redis.
- Address negative Core Web Vitals issues.
- Leverage Common UX Patterns starting with keeping fonts, carousels, and banners within best practices.
- Use Minification to decrease what code will be sent to the browser and compact the code down that must be sent.
- Concatenate your JS and CSS files to deliver them in two or three files.
- Eliminate Render Blocking.
- Use Preconnect and Prefetch for critical assets in your page.
- Image Related techniques including Lazy Loading, Image Optimization, and Image Facades.
- Review and address 404s as WordPress is typically set up to handle all requests through PHP and thus must process all 404s, including image 404s. 404s can be large scale and wasteful.
- Disable Plugins on Pages where they are not being used. Plugin bloat can be effectively fought by selectively using Plugins only on the pages that need the functionality provided by the Plugin. This is an advanced technique that is very powerful.
Top 10 Techniques to Improve Your WordPress Performance
Those 3 areas will significantly improve performance and resiliency under high traffic. In addition to this Summary we suggest you review the core background information including:
- Setting Your Performance Goals
- Understanding a Website Request
- Server Monitoring & Adjusting Performance
Website performance is a critical factor in the success of any website. Our mission is to help you meet your performance and resilience goals for your High Traffic and High Performance WordPress Website.

Setting Your Performance Goals
Determining goals for optimizing a website’s speed and performance is crucial to achieving desired outcomes. Here are some steps to help you establish clear goals and objectives:
- Define your purpose: Start by understanding why you want to optimize your site’s speed and performance. Is it to enhance user experience, reduce bounce rates, improve conversion rates, or achieve better search engine rankings? Clarifying your purpose will guide your goal-setting process.
- Analyze current performance: Use tools like Google Lighthouse, Google PageSpeed Insights, Google Search Console, or WebPageTest to evaluate your website’s current speed and performance. Identify areas where improvements are needed, such as slow loading times, excessive page weight, or high server response times. These insights will help you prioritize and set specific goals.
- Prioritize metrics: Determine which performance metrics are most important for your website. Common metrics include page load time, time to first byte (TTFB), render start time, and interactive time. Align these metrics with your purpose to identify the most critical areas for improvement.
- Set measurable targets: Establish specific, measurable, achievable, relevant, and time-bound (SMART) goals. For example, set a goal to reduce page load time by 30% within three months or achieve a TTFB of under 200 milliseconds. Clear targets will provide a benchmark for progress and help you stay focused.
- Consider user expectations: Understand your target audience’s expectations and browsing behavior. Different websites may require different levels of optimization based on their user base. Consider factors like device usage (mobile vs. desktop), geographic location, and connection speeds to tailor your goals accordingly.
- Break it down: Divide your optimization goals into smaller, actionable tasks. For instance, optimizing image sizes, minifying CSS and JavaScript, leveraging browser caching, or implementing a content delivery network (CDN). Breaking down goals into manageable steps makes them more achievable and allows for incremental improvements.
- Monitor and iterate: Regularly monitor your website’s performance using performance monitoring tools or website analytics. Track progress towards your goals and identify areas that need further optimization. Continuously iterate your strategies to adapt to changing technologies and user expectations.
By following these steps, you can establish well-defined goals for optimizing your website’s speed and performance. Remember, the goals should be aligned with your website’s purpose, measurable, and adaptable to evolving needs.
Performance Testing Tools
There are many testing tools available online to gauge your website performance. In this section, we want to get a website to rank better on Google, so we will use Google’s tools to achieve our goals. There are also some other pretty awesome optimization tools such as GTMetrix, Pingdom, and many others.
Google Lighthouse
Before we explain how to assess your site prior to optimizing, let’s go over a quick outline of how the different pieces are weighted in the Lighthouse tests. The Lighthouse Scoring Calculator gives this information at a glance, and even allows you to plug in your own scores to understand how your overall PageSpeed score is calculated.
Inside Chrome’s Developer Tools (DevTools), you can use the code inspector to get to the Open Source Extension for Google Lighthouse. It is helpful because it runs tests right within your browser, and generates a report for you on how well the website you are looking at stacks up for both mobile and desktop versions. This test gives you information about performance, accessibility, best practices, and SEO.
Tip: When performing a test with DevTools, you want to use an incognito window or guest account, as browser extensions typically interfere with the test and skew the results.
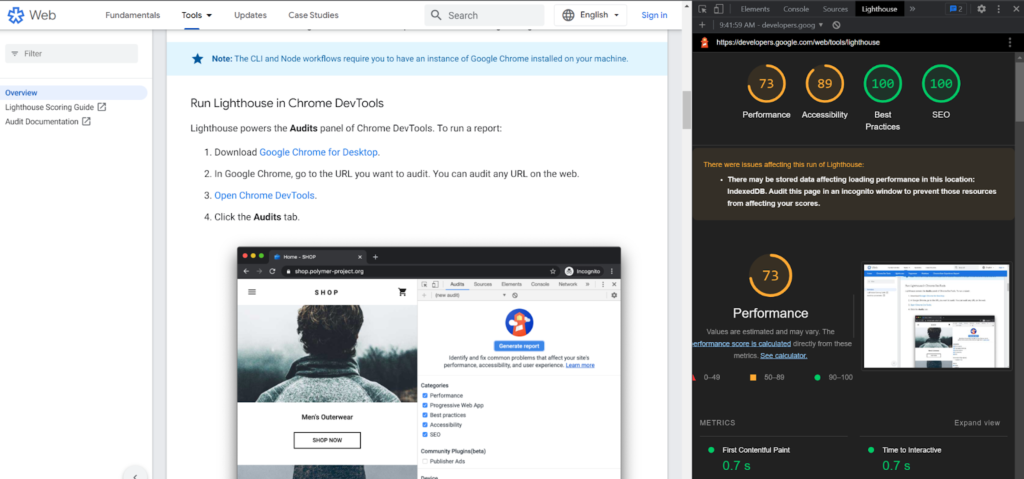
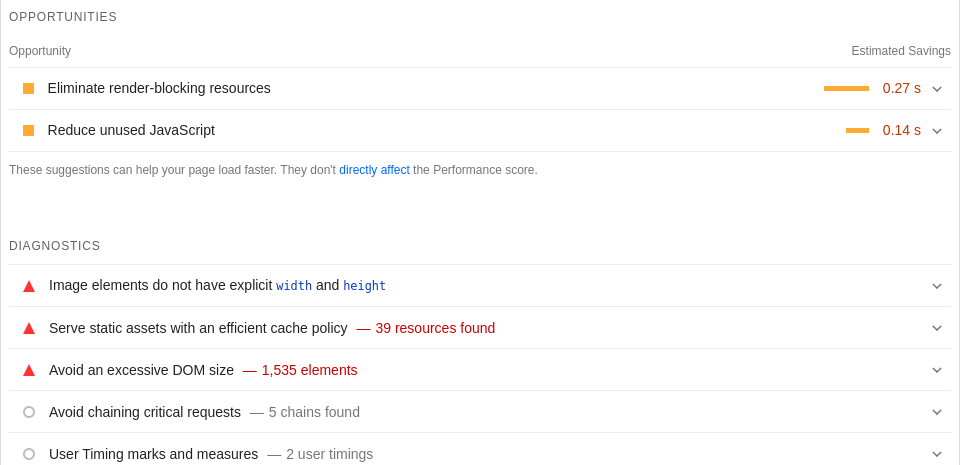
Google Lighthouse also provides an “opportunity” list with items you can optimize on your page to improve your site’s pagespeed, and by proxy, improve the performance scoring of your page.
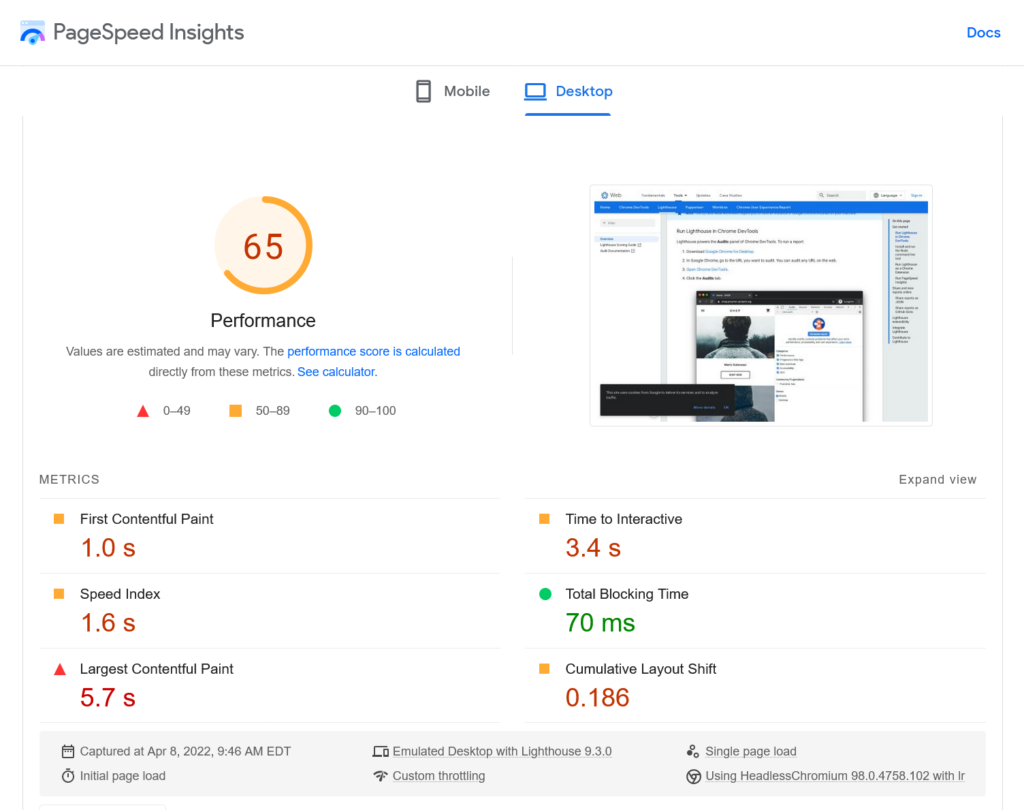
PageSpeed Insights
PageSpeed Insights (PSI) is an online tool that tests your site and then delivers a score for both mobile devices and desktop computers. You will see a score and a breakdown of the metrics used to determine your site performance. PSI will also provide a breakdown of the issues causing any slowdowns to the performance of your site. Recommendations are provided on actions you can take to improve performance. PSI uses simulations and real-world data (when available) to provide its scores.
Chrome User Experience Report
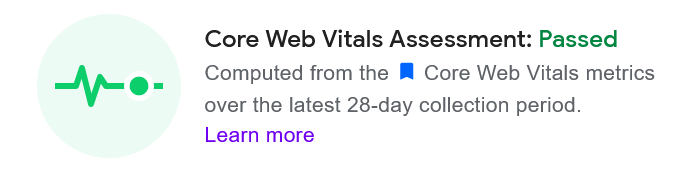
The Chrome User Experience Report is also called the Core Web Vitals metrics. This is an aggregate of user experience metrics that is compiled from actual users that visit your website over the last 28 days.
This data is not comprehensive, however. These users are limited to people that have opted to sync their browser history with Chrome, and the data is made available by PageSpeed Insights, Google’s BigQuery project, and Data Studio. While it is helpful information when optimizing your website for speed and performance, it is not representative of everyone’s experience with your site.
Google Search Console
The Page Experience report in Google’s Search Console provides you with a summary of their measurement for your visitors’ user experience. Google evaluates these metrics for individual URLs on your website and will use them as a ranking signal in search results.
This report covers Core Web Vitals, mobile usability, and HTTPS usage for every page that you have in Google’s index. In order for a page to be counted in this report’s data, it must also have data in the Core Web Vitals report simultaneously.
Other Performance Testing Tools
We should mention other tools as well because this is by no means an exhaustive list.
In short, there are a ton of professional tools that you can use to measure your website’s performance, such as GTMetrix, Pingdom, WebPageTest, and more.
Any tool you use will guide you with things that need to be done to improve your website speed.
Why Are My Scores Always Different?
There are many factors that will impact the score you see on these tests. These variables can range from your location related to the website, activity on your server, network routes, and even the activity on your local computer.
Because of these and many other factors, no two tests will show the exact same results.
However, with a little persistence, you can minimize the impact that your server and website bring into the equation. Simply follow the suggestions, learn about them and implement best practices. This will increase the likelihood that your visitors will have a good user experience.
View Lighthouse’s Score Variability documentation for a table containing several common sources of metric variability, the impact they have on results, and the extent to which they are likely to occur in different environments.
Speed and Performance Indicators
When testing your website’s performance and putting together your plan of attack, the tool you use will dictate the metrics used in the audit. Here are the top performance indicators to pay attention to. We recommend focusing on achieving passing (green) scores on Core Web Vitals before you move onto the other performance metrics.
| Performance Metric | Passing Score | Core Web Vital | Testing Tools |
|---|---|---|---|
| Cumulative Layout Shift (CLS) Measures visual stability. | 0 – 0.1 | Yes | Google Lighthouse, PageSpeed Insights, Google Search Console |
| First Contentful Paint (FCP) Measures time to render the first piece of DOM content. | 0 – 1800ms | No | Google Lighthouse, PageSpeed Insights, Google Search Console, GTmetrix |
| First Input Delay (FID) Measures a website’s interactivity. | 0 – 100ms | Yes | PageSpeed Insights, Google Search Console |
| Largest Contentful Paint (LCP) Measures when the largest content element in the viewport is rendered to the screen. | 0 – 2.5s | Yes | Google Lighthouse, PageSpeed Insights, Google Search Console, GTmetrix |
| Speed Index (SI) Measures how quickly content is visually displayed during page load. | No | Google Lighthouse, PageSpeed Insights, GTmetrix | |
| Total Blocking Time (TBT) Measures the total amount of time a page is blocked from responding to user input. | 0 – 200ms | No | Google Lighthouse, PageSpeed Insights, GTmetrix |
| Time to First Byte (TTFB) Measures server response times. | 0 – 200ms | No | PageSpeed Insights, GTmetrix |
Core Web Vitals
The key to success for your website is to focus on the user experience. Google’s Core Web Vitals are a set of metrics that measure real-world user experience for loading performance, interactivity, and visual stability of the page. These metrics are designed to help you understand how good the user experience is on your site compared to other sites on the web.
Core Web Vitals are broken down into a subset of page experience signals that apply to all websites and should be measured by website owners. The metrics that make up Core Web Vitals are subject to evolve over time as these signals are not set in stone, and are intended to change as time passes to continue improving the overall user experience on the web.
Page Experience Signals and Core Web Vitals are the best signals that developers have to measure and improve the quality of user experience, and they are broken down into Largest Contentful Paint (LCP), First Input Delay (FID), and Cumulative Layout Shift (CLS). Below, we will outline what each signal is, and share some best practices and steps to take to ensure you improve your website’s performance in relation to each metric.
Tools that measure Core Web Vitals consider a page to be passing if it meets the recommended target of 75th percentile for all 3 metrics.
Largest Contentful Paint (LCP)
LCP measures your website’s loading performance. In order to provide a good user experience for your visitors, your LCP should occur within 2.5 seconds of the initial page loading.
The types of elements that are considered for largest contentful paint are usually images or videos. It is important to understand that an element can only be considered the LCP once it is rendered, and the user can see it.
This metric is also tied to First Contentful Paint (FCP), which measures how long it takes for the initial DOM content to render, but FCP does not account for how long it takes the largest and usually more important content on page to render.
- What LCP represents: A user’s perception of loading experience.
- Lighthouse Performance score weighting: 25%
- What it measures: The point in the page load timeline when the page’s largest image or text block is visible within the viewport.
- How it’s measured: Lighthouse extracts LCP data from Chrome’s tracing tool.
- Is Largest Contentful Paint a Web Core Vital? Yes
LCP Scoring
| LCP Time (seconds) | Color-Coding Score |
|---|---|
| 0 – 2.5 seconds | Green (Fast / Good) |
| 2.5 – 4.0 seconds | Orange (Moderate / Needs Improvement) |
| Over 4.0 seconds | Red (Slow / Poor) |
What Elements are Part of LCP?
<img>elements<image>elements inside an<svg>element<video>elements (the poster image is used)- An element with a background image loaded via the url() function (as opposed to a CSS gradient)
- Block-level elements containing text nodes or other inline-level text elements children.
How To Define LCP Using Chrome DevTools
- Open the page in Chrome.
- Navigate to the Performance panel of DevTools (Command + Option + I on Mac or Control + Shift + I on Windows and Linux).
- Hover over the LCP marker in the Timings section.
- The element(s) that correspond to LCP is detailed in the Related Node field.
What Causes Poor LCP?
Poor LCP typically comes from four issues:
- Slow server response times.
- Render-blocking JavaScript and CSS.
- Resource load times.
- Client-side rendering.
How to Improve LCP
The usual suspects of a poor LCP can be caused by many things. Some of the causes can be slow response times from the server, render blocking JavaScript and CSS, slow resource load times and even client rendering.
Slow server response times is the first thing you should tackle when optimizing for performance. A faster server response will directly impact and improve every page loading measurement, including LCP.
If the cause is slow server response time:
- Optimize your server.
- Route users to a nearby CDN.
- Cache assets.
- Serve HTML page cache-first.
- Establish third-party connections early.
If the cause is render-blocking JavaScript and CSS:
- Minify CSS.
- Defer non-critical CSS.
- Inline critical CSS.
- Minify and compress JavaScript files.
- Defer unused JavaScript.
- Minimize unused polyfills.
If the cause is resource load times:
- Optimize and compress images.
- Preload important resources.
- Compress text files.
- Deliver different assets based on the network connection (adaptive serving).
- Cache assets using a service worker.
If the cause is client-side rendering:
- Minimize critical JavaScript.
- Use another rendering strategy.
First Input Delay (FID)
First Input Delay (FID) measures a website’s interactivity and focuses on input events from discrete actions like clicks, taps, and key presses. When a website does not respond in a certain amount of time after a user interaction, users experience this as lag, or slowdown. To provide a good user experience your web pages should have a FID of 100 milliseconds or less.
- What it represents: Your user’s first impression of your site’s interactivity and responsiveness.
- Lighthouse Performance score weighting: N/A
- What it measures: Measures the time from when a user first interacts with your site (when they click a link, tap a button, or use a custom, JavaScript-powered control) to the time when the browser is actually able to respond to that interaction.
- How it’s measured: FID requires a real user and thus cannot be measured in the lab. However, the Total Blocking Time (TBT) metric is lab-measurable and can be used as a proxy as it correlates well with FID in the field, and also captures issues that affect interactivity. Optimizations that improve TBT should also improve FID in the field.
- Is Largest Contentful Paint a Web Core Vital? Yes
FID Scoring
| FID Time (milliseconds) | Color-Coding Score |
|---|---|
| 0 – 100 milliseconds | Green (Fast / Good) |
| 101 – 300 milliseconds | Orange (Moderate / Needs Improvement) |
| Over 300 milliseconds | Red (Slow / Poor) |
What Causes Poor FID?
The main cause of a poor FID is heavy JavaScript execution. Optimizing how JavaScript parses, compiles, and executes on your web page will directly reduce FID.
How to Improve FID
- Reduce the impact of third-party script execution
- Reduce JavaScript execution time
- Defer unused JavaScript
- Minimize unused polyfills
- Break up Long Tasks
- Optimize your page for interaction readiness
- Use a web worker
- Minimize main thread work
- Keep request counts low and transfer sizes small
Cumulative Layout Shift (CLS)
CLS measures visual stability. A good user experience is measured as having a CLS of 0.1 or less. This allows the experience to avoid any surprises for the user but isn’t particularly helpful for page speed, it’s more a measurement that your website is following best practices and is a necessary piece for achieving a high performance score for your page.
These best practices include following common UX patterns that are optimized for CLS. When your page is loading, you should always be sure to set size attributes or reserve space. This will help ensure your page does not jitter and move for the customer while they are trying to interact with it.
Your website should never insert content above existing content unless a user interacts and expects the behavior, and you should always use transform animations when transforming the layout during said interactions.
- What it represents: The visual stability of a page. Instability is defined as unexpected movement of page content as the user is trying to interact with the page.
- Lighthouse Performance score weighting: 15%
- What it measures: CLS measures the largest burst of layout shift scores for every unexpected layout shift that occurs during the entire lifespan of a page. A layout shift occurs any time a visible element changes its position from one rendered frame to the next.
- How it’s measured: To calculate the layout shift score, the browser looks at the viewport size and the movement of unstable elements in the viewport between two rendered frames. The layout shift score is a product of two measures of that movement: the impact fraction and the distance fraction
- Is Cumulative Layout Shift a Web Core Vital? Yes
CLS Scoring
| CLS Scores | Color-Coding Score |
|---|---|
| 0.1 | Green (Fast / Good) |
| 0.1 – 0.25 | Orange (Moderate / Needs Improvement) |
| Over 0.25 | Red (Slow / Poor) |
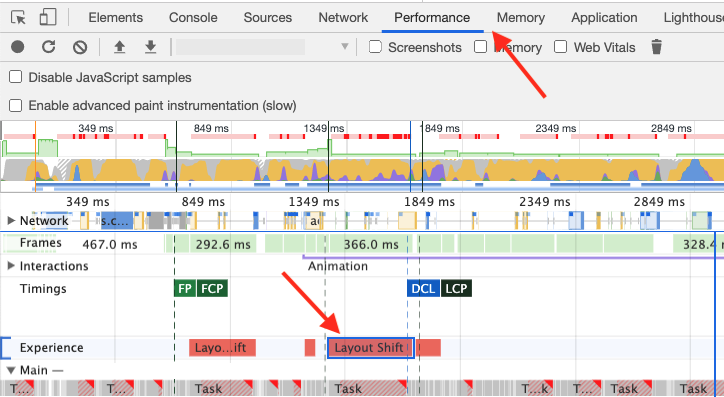
How To See CLS Using Chrome DevTools
Use DevTools to help debug layout shifts by leveraging the Experience pane under the Performance panel.
The Summary view for a Layout Shift record includes the Cumulative Layout Shift score as well as a rectangle overlay showing the affected regions.
What Causes Poor Layout Shifts?
- Changes to the position of a DOM element
- This is often the result of:
- Stylesheets that are loaded late or overwrite previously declared style.
- Delays in animation and transition effects.
- This is often the result of:
- Changes to the dimensions of a DOM element
- This often the result of:
- Images, ads, embeds, and iframes without dimensions
- This often the result of:
- Insertion or removal of a DOM element
- Animations that trigger layout
- This is often the result of:
- Insertion of ads and other third-party embeds.
- Insertion of banners, alerts, and modals.
- Infinite scroll and other UX patterns that load additional content above existing content.
- This is often the result of:
- Actions waiting for a network response before updating DOM
How to Improve CLS
- Always set size attributes to images and video elements, or allocate the correct amount of space for that element while it is loading.
- Never insert content above existing content, except during an intentional user interaction.
- Prefer transform animations to animations of properties that trigger layout changes.
- Preload fonts using
<link rel=preload>on the key web fonts, and combine<link rel=preload>withfont-display: optional
Additional Resources
- Cumulative Layout Shift (CLS) – web.dev
- Optimize Cumulative Layout Shift – web.dev
- Debug Layout Shifts – web.dev
Other Performance Opportunities
First Contentful Paint (FCP)
Measures time to render the first piece of DOM content.
- What it represents: The amount of time it takes the browser to render the first piece of DOM content after a user navigates to your page. Images, non-white <canvas> elements, and SVGs on your page are considered DOM content.
- Lighthouse Performance score weighting: 10%
- What it measures: FCP is a user-centric metric for measuring perceived load speed because it marks the first point in the page load timeline where the user can see anything on the screen.
- How it’s measured: The FCP score is a comparison of your page’s FCP time and FCP times for real websites, based on data from the HTTP Archive.
- Is Largest Contentful Paint a Web Core Vital? No
FCP Scoring
| FCP Time (seconds) | Color-Coding Score |
|---|---|
| 0 – 1.8 seconds | Green (Fast / Good) |
| 1.8 – 3 seconds | Orange (Moderate / Needs Improvement) |
| Over 3 seconds | Red (Slow / Poor) |
How to Improve FCP
- Eliminate render-blocking resources
- Minify CSS
- Remove unused CSS
- Preconnect to required origins
- Reduce server response times (TTFB)
- Avoid multiple page redirects
- Preload key requests
- Avoid enormous network payloads
- Serve static assets with an efficient cache policy
- Avoid an excessive DOM size
- Minimize critical request depth
- Ensure text remains visible during webfont load
- Keep request counts low and transfer sizes small
Additional Resources
- First Contentful Paint (FCP) – web.dev
Speed Index (SI)
- What it represents: The average time at which visible parts of the page are displayed.
- Lighthouse Performance score weighting: 10%
- What it measures: Speed Index measures how quickly content is visually displayed during page load. Lighthouse first captures a video of the page loading in the browser and computes the visual progression between frames.
- How it’s measured: The Speed Index score is a comparison of your page’s speed index and the speed indices of real websites, based on data from the HTTP Archive.
- Is Largest Contentful Paint a Web Core Vital? No
Speed Index Scoring
| Speed Index (seconds) | Color-Coding Score |
|---|---|
| 0 – 3.4 seconds | Green (Fast / Good) |
| 3.4 – 5.8 seconds | Orange (Moderate / Needs Improvement) |
| Over 5.8 seconds | Red (Slow / Poor) |
How to Improve Speed Index
- Minimize main thread work
- Reduce JavaScript execution time
- Ensure text remains visible during webfont load
- Eliminate render-blocking resources
Additional Resources
- Speed Index – web.dev
- WebPagetest Speed Index
Total Blocking Time (TBT)
- What it represents: The total amount of time that a page is blocked from responding to user input, such as mouse clicks, screen taps, or keyboard presses.
- Lighthouse Performance score weighting: 30%
- What it measures: TBT measures the time between First Contentful Paint and Time to Interactive. TBT is the lab equivalent of First Input Delay (FID) – the field data used in the Chrome User Experience Report and Google’s Page Experience ranking signal.
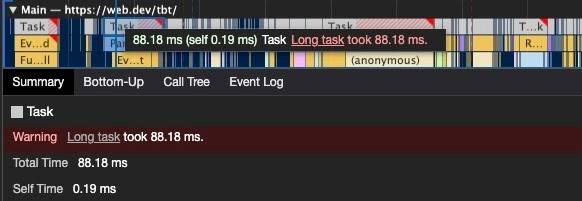
- How it’s measured: The total time in which the main thread is occupied by tasks taking more than 50ms to complete. If a task takes 80ms to run, 30ms of that time will be counted toward TBT. If a task takes 45ms to run, 0ms will be added to TBT.
- Is Total Blocking Time a Web Core Vital? Yes! It’s the lab data equivalent of First Input Delay (FID).
TBT Scoring
| TBT Time (milliseconds) | Color-Coding Score |
|---|---|
| 0 – 200ms | Green (Fast / Good) |
| 200 – 600ms | Orange (Moderate / Needs Improvement) |
| Over 600ms | Red (Slow / Poor) |
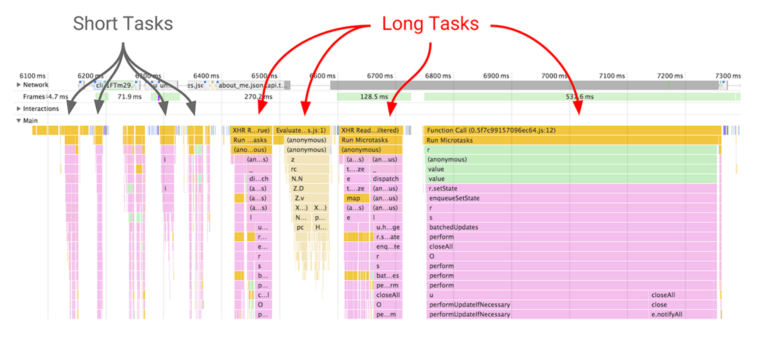
Long Tasks and Total Blocking Time
TBT measures long tasks – those taking longer than 50ms.
When a browser loads your site, there is essentially a single line queue of scripts waiting to be executed. Any input from the user has to go into that same queue.
When the browser can’t respond to user input because other tasks are executing, the user perceives this as lag.
Essentially, long tasks are like that person at your favorite coffee shop who takes far too long to order a drink. Like someone ordering a 2% venti four-pump vanilla, five-pump mocha whole-fat froth, long tasks are a major source of bad experiences.
What Causes High TBT on your Page?
- Heavy JavaScript
- Heavy CSS
That’s it.
How To See TBT Using Chrome DevTools
How to Improve TBT
- Break up Long Tasks.
- Optimize your page for interaction readiness.
- Use a web worker.
- Reduce JavaScript execution time.
Additional Resources
- First Input Delay (FID) – web.dev
- Total Blocking Time (TBT) – web.dev
- Optimize First Input Delay – web.dev
- Lighthouse: Total Blocking Time – web.dev
Time to First Byte (TTFB)
Time to First Byte (TTFB) is a foundational metric for measuring the time between the request for a resource and when the first byte of a response begins to arrive. It helps identify when a web server is too slow to respond to requests.
TTFB is the sum of the following request phases:
- Redirect time
- Service worker startup time (if applicable)
- DNS lookup
- Connection and TLS negotiation
- Request, up until the point at which the first byte of the response has arrived
TTFB Scoring
| TTFB Time (milliseconds) | Color-Coding Score |
|---|---|
| 0 – 800ms | Green (Fast / Good) |
| 800 – 1,800ms | Orange (Moderate / Needs Improvement) |
| Over 1,800ms | Red (Slow / Poor) |
How to Improve TTFB
- Hosting services with inadequate infrastructure to handle high traffic loads
- Web servers with insufficient memory that can lead to thrashing
- Unoptimized database tables
- Suboptimal database server configuration
- Avoid multiple page redirects
- Preconnect to required origins for cross-origin resources
- Submit your origin to the HSTS preload list to eliminate HTTP-to-HTTPS redirect latency
- Use HTTP/2 or HTTP/3
- Use server-side generation (SSG) for markup instead of SSR where possible and appropriate
Minimizing TTFB starts with choosing a suitable hosting provider with infrastructure to ensure high uptime and responsiveness. This in combination with a CDN can help significantly.
Additional Resources
- Time to First Byte (TTFB) – web.dev
Time to Interactive (TTI)
In February 2023, Google Chrome announced that it would remove the Time To Interactive (TI) score in Lighthouse 10.
Time to Interactive (TTI) measures how long it takes a page to become fully interactive. The reason for removing TTI is because other metrics like Largest Contentful Paint (LCP), Speed Index, and Total Blocking Time together are better measures of when a webpage feels loaded.
Improve the performance and security of your WordPress website with our WordPress VPS Hosting plans.
![]() Web Application Firewalls
Web Application Firewalls ![]() Free SSL Certificates
Free SSL Certificates ![]() Advanced Server Caching
Advanced Server Caching
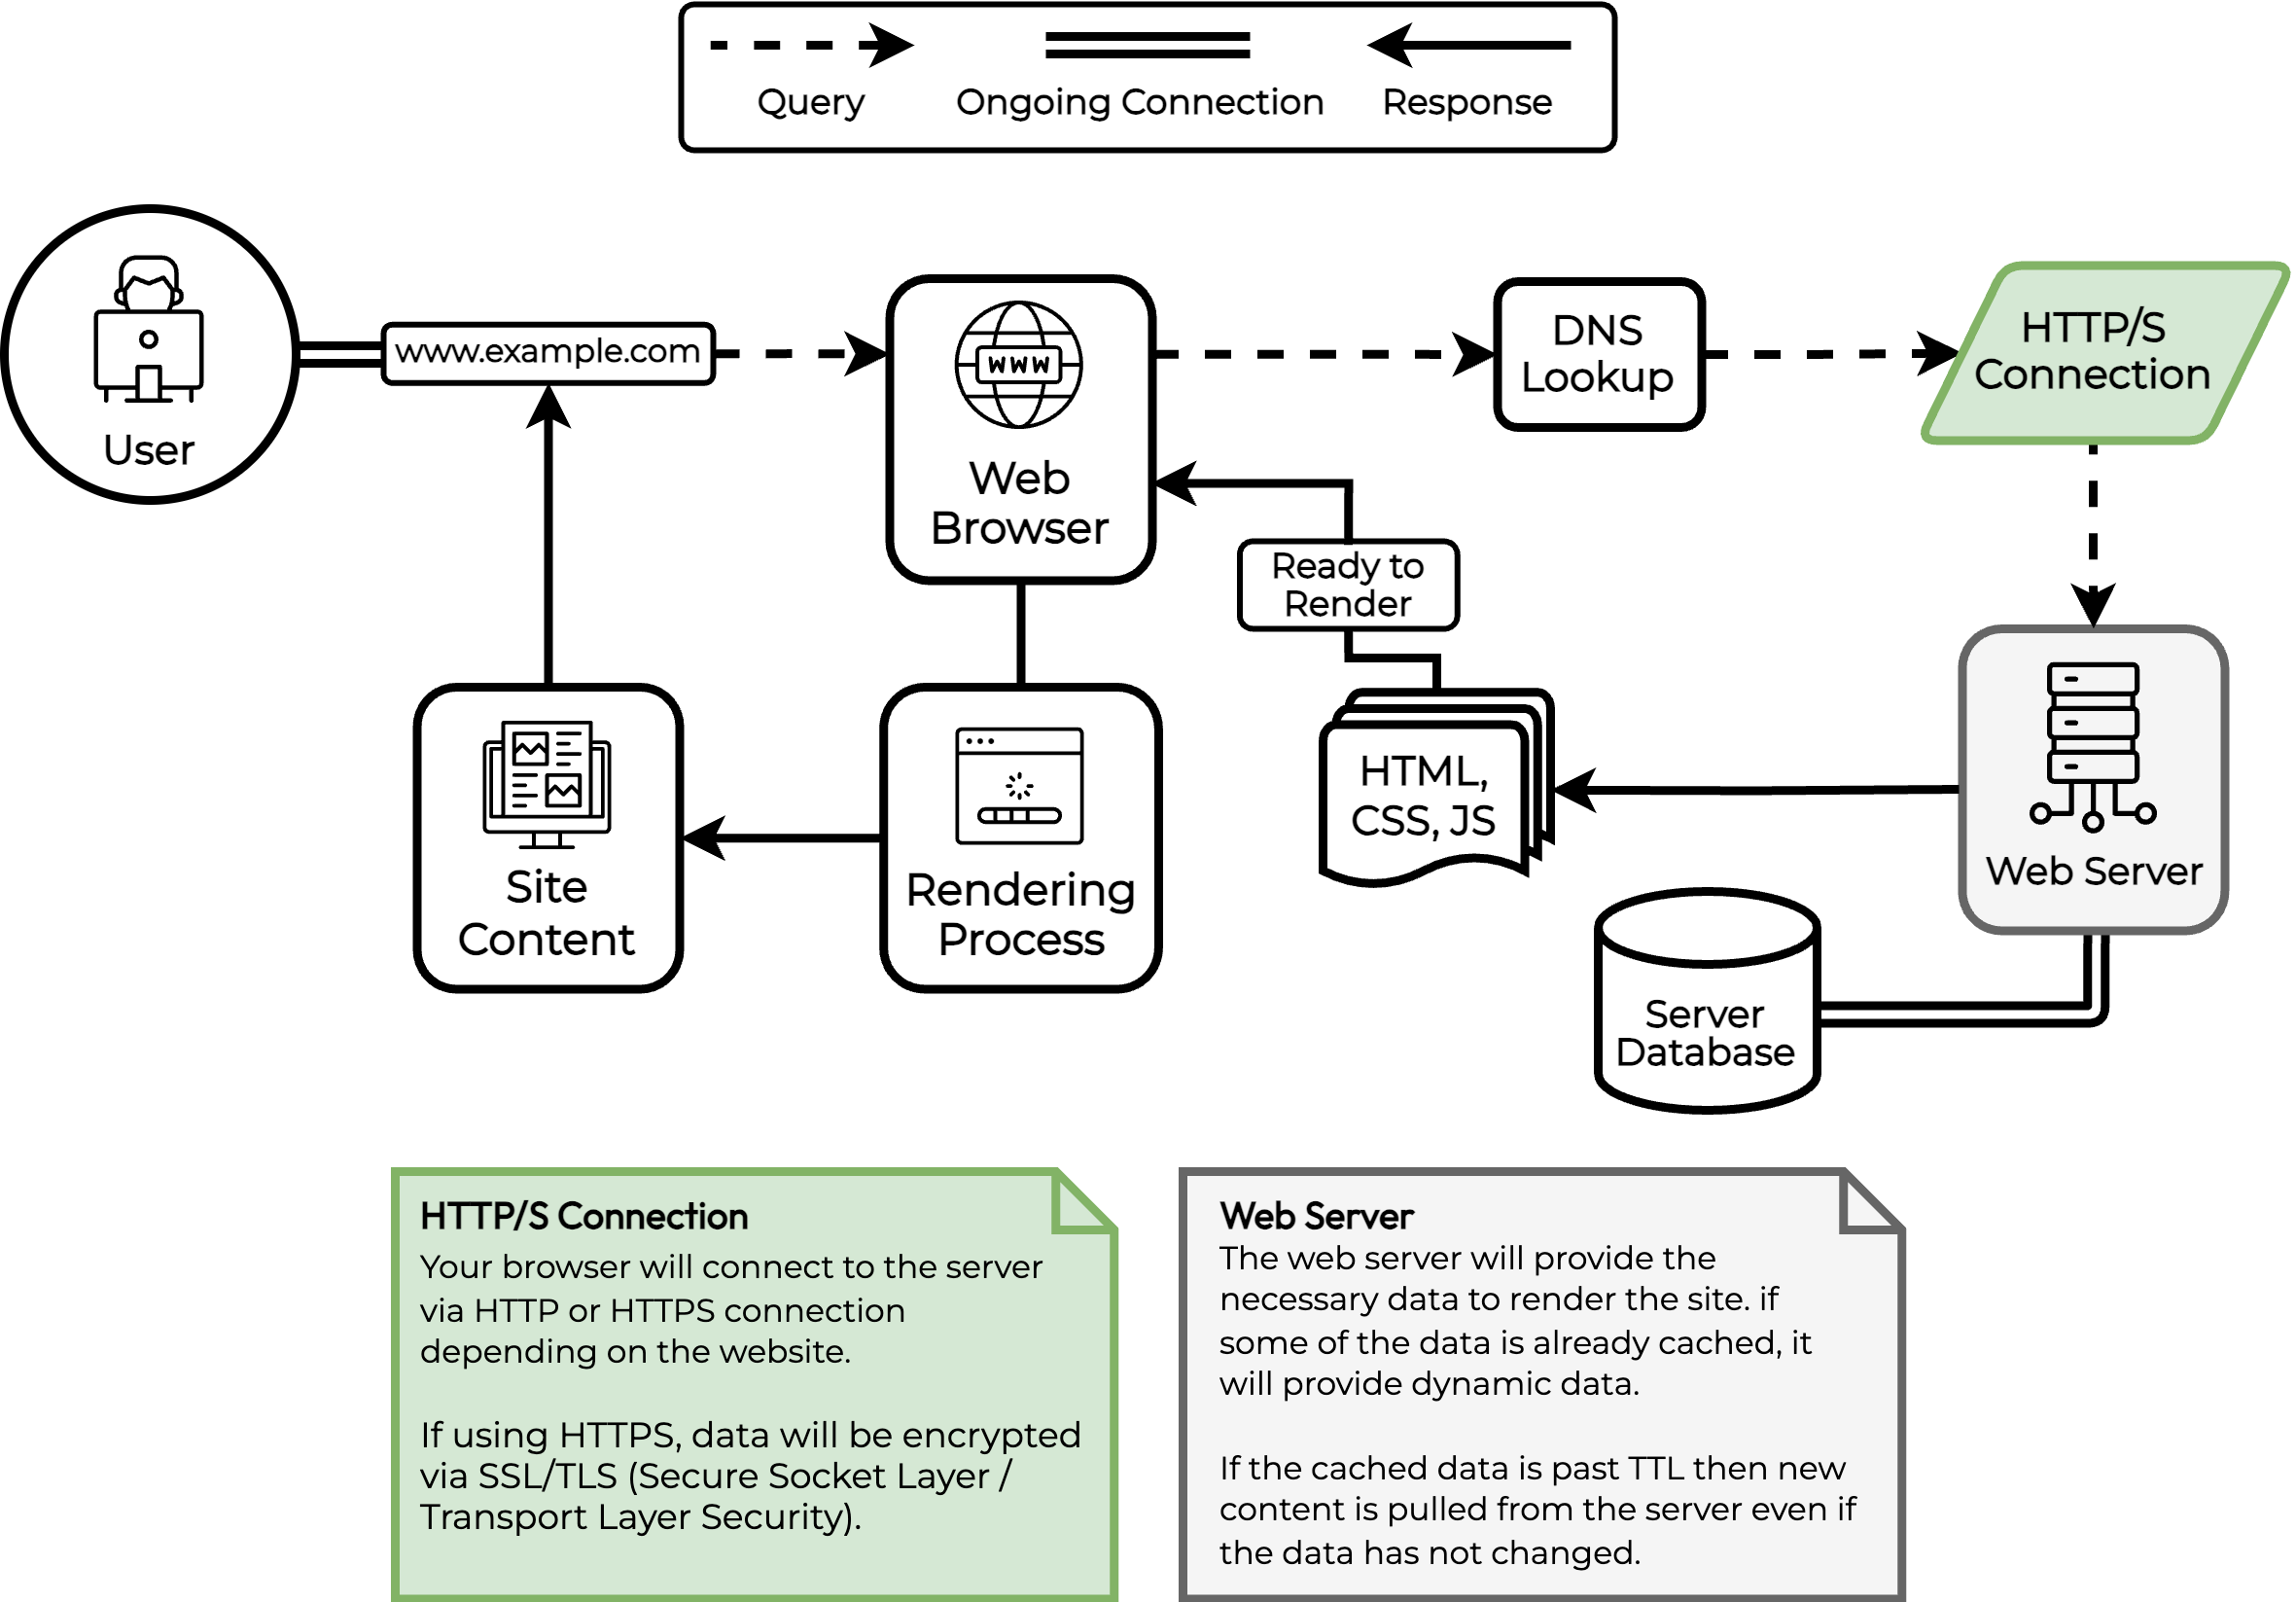
Understanding a Website Request
In this section, we’ll discuss how the speed of a request to a website impacts overall website performance.
When a user makes a request to load a website, a series of processes happen behind the scenes to deliver the requested content to the user’s browser. The process can be broken down into the following steps:
- DNS Lookup: The Domain Name System (DNS) is a distributed database that maps domain names to IP addresses. When a user types a URL into their browser, the browser first sends a request to a DNS server to look up the IP address of the domain name.
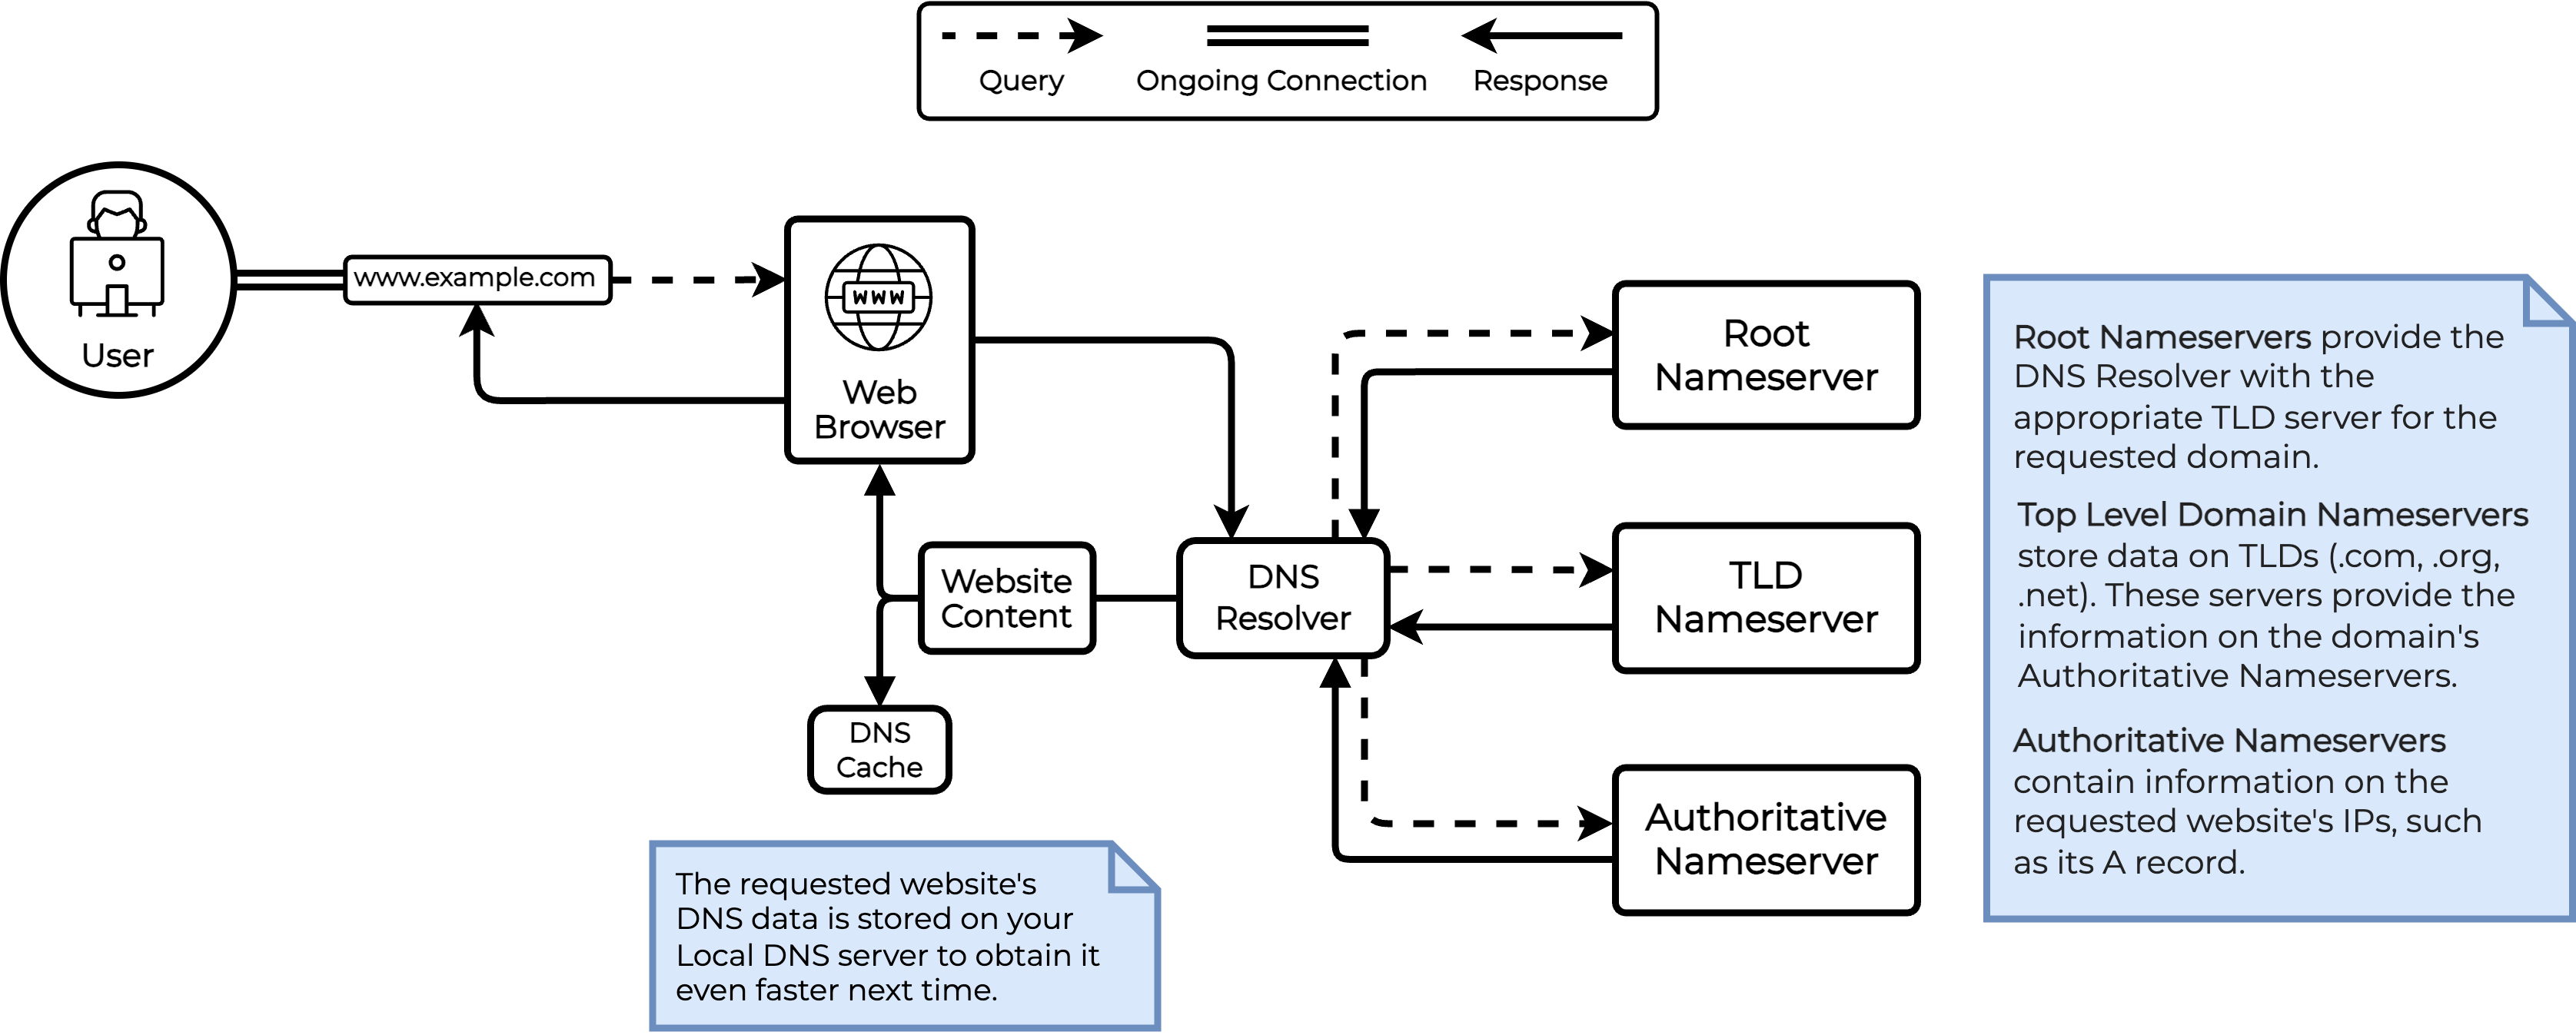
- Connection: Once the browser has the IP address of the website, it establishes a connection to the server hosting the website using the Hypertext Transfer Protocol (HTTP) or the more secure HTTPS protocol.
- Request: After establishing the connection, the browser sends an HTTP request to the server requesting the specific web page or resource that the user wants to access.
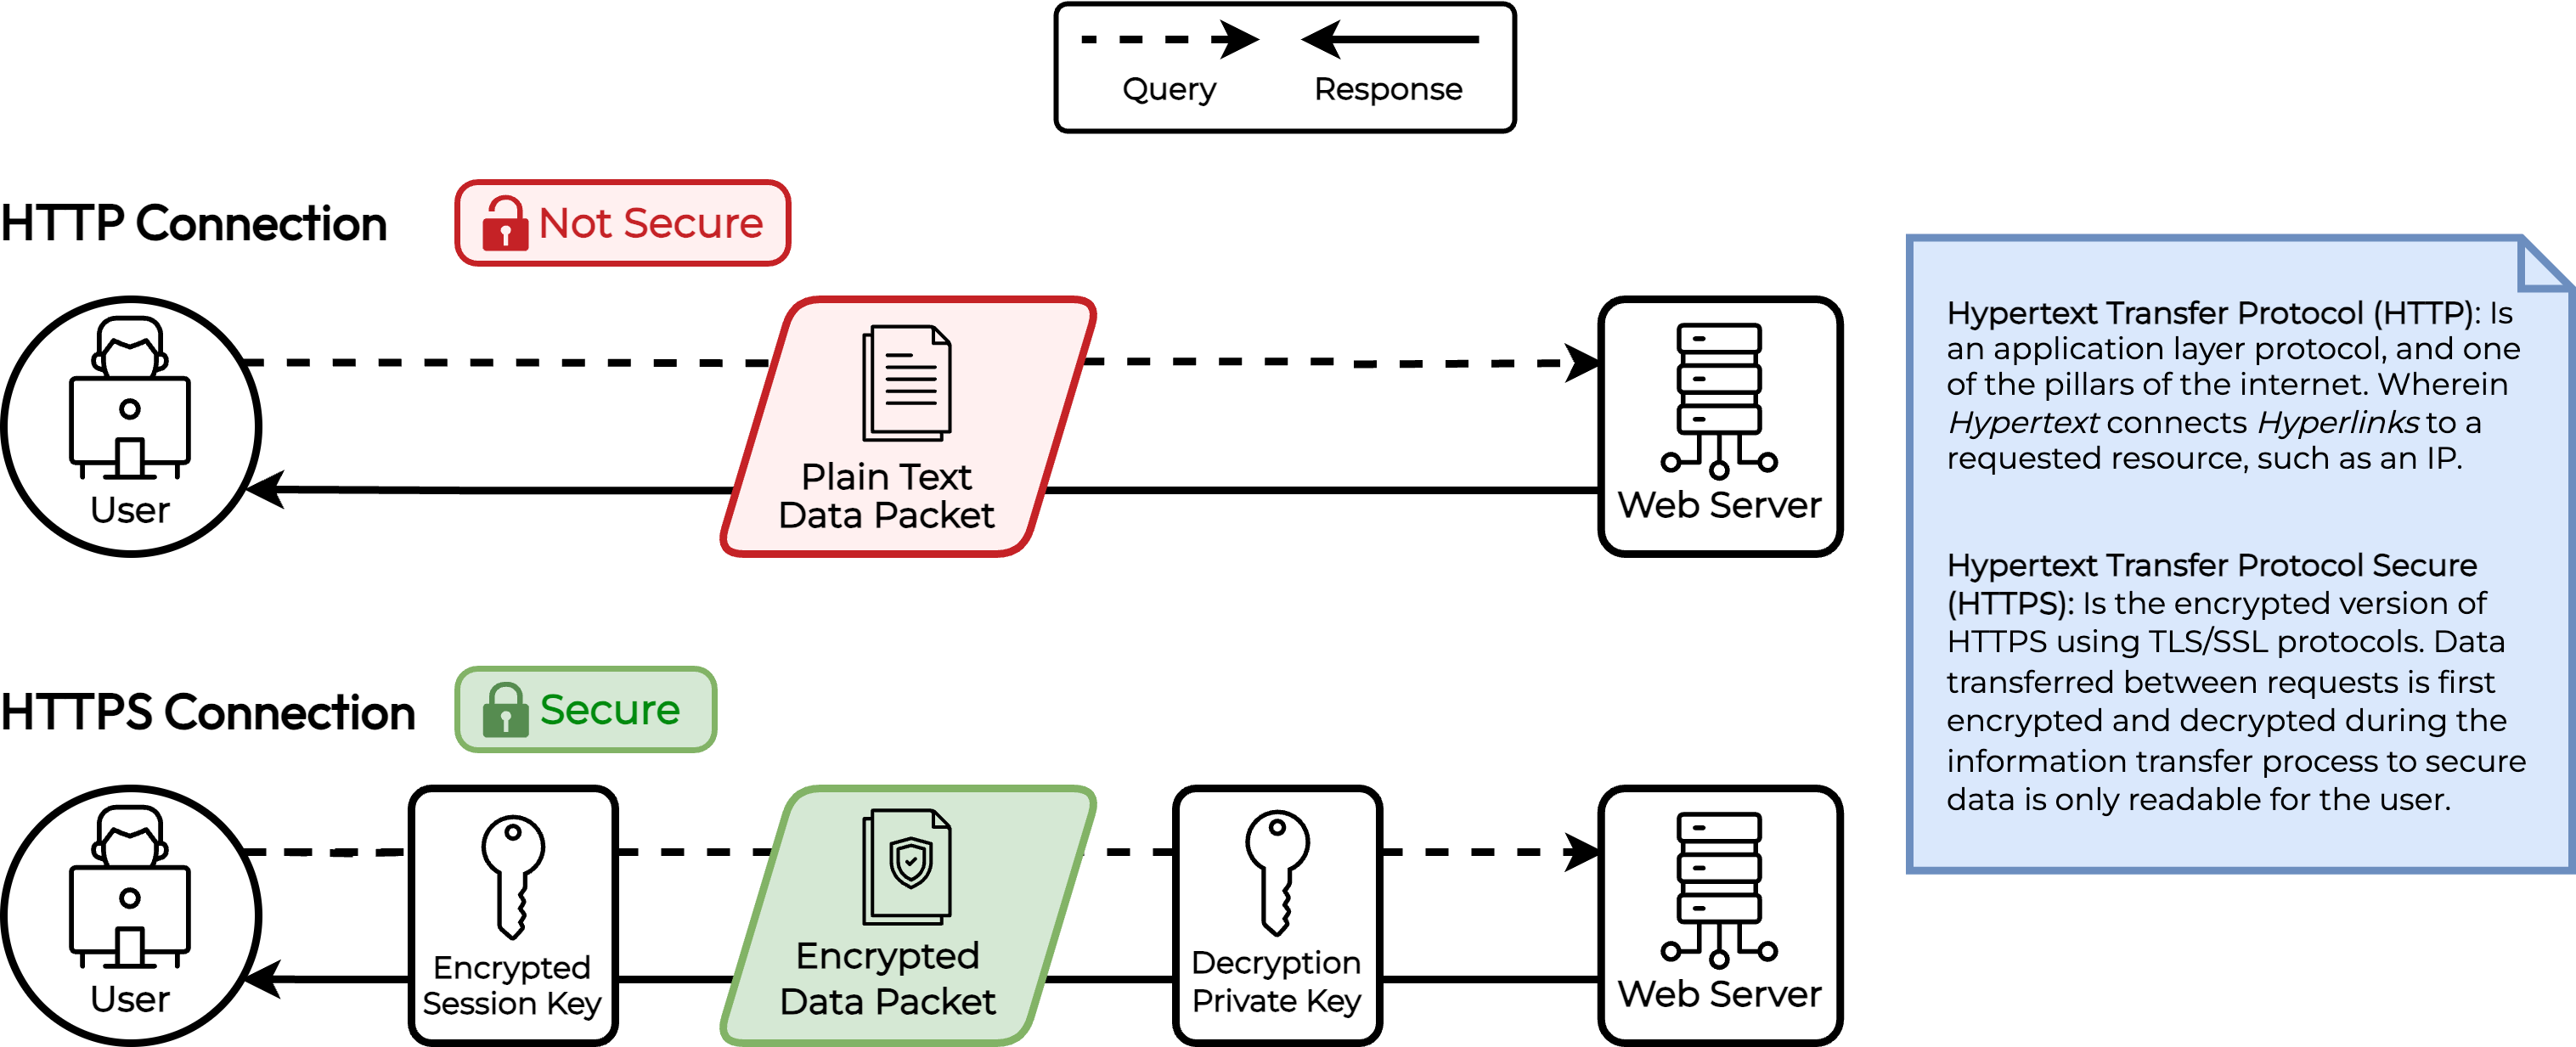
- Processing: The server receives the request and begins to process it. This may involve executing scripts, querying databases, and retrieving files from the file system.
- Response: Once the server has processed the request, it sends an HTTP response back to the browser. This response includes the requested content, such as the HTML, CSS, JavaScript, and any images or other resources required to display the web page.
- Rendering: The browser receives the response from the server and begins to render the web page. This involves parsing the HTML and rendering the layout, styling the page with CSS, executing JavaScript, and loading any images or other resources required to display the page.
- User Interaction: Finally, the user can interact with the web page, clicking on links, filling out forms, and performing other actions.
These steps happen very quickly, often in a matter of milliseconds, but any delay or bottleneck in any of these steps can cause the page to load slowly or not at all, leading to a poor user experience. To optimize website performance, it’s important to identify and address any performance issues at each stage of this process.
Server Configuration & Tuning for WordPress
These tips explain what measures can be taken with Redis, MySQL, Opcache, and other technologies to achieve a high performance server. There are many opportunities to improve performance. We focus on fast storage and emphasize tuning the cache. Accessing files from NVMe storage, storing PHP scripts in Opcache, and compressing responses with Brotli are all part of a high performance server. Read on to find out how to analyze your server performance and make incremental improvements.
PHP Server Side Options
The web server communicates with PHP-FPM, which is a separate process responsible for handling PHP requests. The request is passed from the web server to PHP-FPM via FastCGI. PHP-FPM checks its configuration settings to determine how to handle the incoming request. This includes settings such as the number of worker processes, maximum execution time, and memory limits.
Worker Processes
The optimal number of worker processes depends on factors such as server resources, expected traffic, and the nature of the PHP application. Adjusting this value requires careful monitoring and performance testing to ensure efficient resource utilization. Assuming an average memory consumption of 64MB per worker, the following matrix can be used as a baseline configuration.
| FPM Worker Matrix | Total System RAM (MB) | ||||||||
| 512 MB | 1024 MB | 2048 MB | 3072 MB | 4096 MB | 6144 MB | 8192 MB | 16384 MB | 32768 MB | |
| pm.max_children | 3 | 6 | 10 | 15 | 20 | 40 | 60 | 80 | 120 |
| pm.min_spare_servers | 1 | 2 | 3 | 5 | 7 | 13 | 20 | 27 | 40 |
| pm.max_spare_servers | 3 | 6 | 10 | 15 | 20 | 40 | 60 | 80 | 120 |
| pm.start_servers | 1 | 2 | 3 | 5 | 7 | 13 | 20 | 27 | 40 |
| Estimated Worker RAM Consumption | 192 MB | 384 MB | 640 MB | 960 MB | 1280 MB | 2562 MB | 3842 MB | 5120 MB | 7668 MB |
The optimal number of worker processes depends on factors such as server resources, expected traffic, and the nature of the PHP application. Adjusting this value requires careful monitoring and performance testing to ensure efficient resource utilization.
Install and Configure Redis
Services like Redis and Memcached can significantly improve WordPress performance by caching data in memory and reducing the number of database calls required to serve content. They act as key-value stores that temporarily hold frequently accessed or computationally expensive data, resulting in faster response times and reduced server load. WordPress can be configured to use Redis as an object store by employing specific plugins, such as Redis Object Cache or W3 Total Cache.
Once Redis is installed and configured, you can check the following items to ensure Redis is optimized and operating at its full capacity.
Memory Usage
Check Redis memory usage with the following command (some output has been omitted):
[root@localhost ~]# redis-cli info memory
used_memory:12654264
used_memory_rss:18878464
used_memory_peak:66619048
total_system_memory:19327352832
used_memory_lua:37888
maxmemory:67108864
maxmemory_policy:allkeys-lru
mem_fragmentation_ratio:1.49
mem_allocator:jemalloc-3.6.0
When used_memory_peak is close to maxmemory, Redis may not have enough resources to operate to its full capacity. In addition, Redis may be actively evicting keys from the cache to make room for new ones. This is not ideal, and key eviction should be avoided if possible. Increase the maxmemory variable in your Redis configuration to resolve this issue.
Key Eviction
Key eviction is the process of removing old and unused data from the cache to make room for new data. This can be especially problematic for high-traffic websites that rely on Redis caching to improve performance. If your system resources allow for it and the evicted_keys count is high, it is again recommended to increase maxmemory. The following command will provide information about the number of keys and how many have been evicted.
# redis-cli info stats | grep evicted_keys
evicted_keys:5463

# redis-cli info keyspace
db0:keys=773,expires=738,avg_ttl=137198
By examining these aspects and making appropriate adjustments, you can optimize Redis to significantly enhance your WordPress site’s performance
Optimize MariaDB
If object caching like Redis is not available for the WordPress site, requests for database content go straight to the database. First, the database checks its cache to serve the result directly, if possible, and stores it for future use. If caching is unavailable or not allowed, the query proceeds to the database. The database combines cached and uncached information, requesting data from the Operating System. The speed of retrieving the data depends on available RAM and the storage type, with NVMe being the fastest and HDD being the slowest. Simple queries return data immediately to the PHP call, while complex queries requiring temp tables demand more processing time and can slow down the website or cause server issues under high traffic.
Several tuning techniques can improve performance.
Set the buffer pool size
The buffer pool is the area of memory that MariaDB uses to cache data and indexes. It is important to configure the buffer pool size appropriately based on the amount of available memory and the size of the database. A good rule of thumb is to set the buffer pool size to about 40% of available memory, but keep in mind this percentage is typically applicable only on stand-alone database servers. The buffer pool size can be controlled using the innodb_buffer_pool_size variable. See https://mariadb.com/kb/en/innodb-buffer-pool/ for more information.
One way to analyze buffer pool performance is by observing the innodb_buffer_pool_wait_free status variable. If it is increasing, then you don’t have enough buffer pool (or your flushing isn’t occurring frequently enough). In this case, you should set the innodb_buffer_pool_size variable higher if your system resources allow for it.
SHOW STATUS LIKE "Innodb_buffer_pool_wait_free";
+------------------------------+-------+
| Variable_name                | Value |
+------------------------------+-------+
| Innodb_buffer_pool_wait_free | 5464  |
+------------------------------+-------+
1 row in set (0.001 sec)
Enable query cache
Query cache is a feature that stores the results of frequently executed queries in memory, which can significantly improve query performance. It is recommended to enable query cache, but it’s important to note that it may not be effective for all workloads. The query cache can be enabled or disabled using the query_cache_type variable. See https://mariadb.com/kb/en/query-cache/ for more information.
The SQL server stores stats about the Query Cache.
SHOW STATUS LIKE 'Qcache%';
+-------------------------+----------+
| Variable_name           | Value    |
+-------------------------+----------+
| Qcache_free_blocks      | 1158     |
| Qcache_free_memory      | 3760784  |
| Qcache_hits             | 31943398 |
| Qcache_inserts          | 42998029 |
| Qcache_lowmem_prunes    | 34695322 |
| Qcache_not_cached       | 652482   |
| Qcache_queries_in_cache | 4628     |
| Qcache_total_blocks     | 11123    |
+-------------------------+----------+
Qcache_inserts contains the number of queries added to the query cache, Qcache_hits contains the number of queries that have made use of the query cache, while Qcache_lowmem_prunes contains the number of queries that were dropped from the cache due to lack of memory.
The above example could indicate a poorly performing cache. More queries have been added, and more queries have been dropped, than have actually been used.
Set In-memory Table Size Limits: As previously mentioned, complex queries will cause the SQL server to create temporary tables. The SQL server will attempt to create tables in memory up to a certain size for performance. It is important to set the max size to an appropriate value to avoid creating on-disk temporary tables. The variables that control this behavior are tmp_table_size and max_heap_table_size. You can compare the number of internal on-disk temporary tables created to the total number of internal temporary tables created by comparing Created_tmp_disk_tables and Created_tmp_tables values. See server-system-variables/#tmp_table_size and server-system-variables/#max_heap_table_size for more information.
You can see if it’s necessary to increase by comparing the status variables Created_tmp_disk_tables and Created_tmp_tables to see how many temporary tables out of the total created needed to be converted to disk.
MariaDB [(none)]> SHOW STATUS LIKE "Created_tmp%";
+-------------------------+-------+
| Variable_name           | Value |
+-------------------------+-------+
| Created_tmp_disk_tables | 0     |
| Created_tmp_files       | 373   |
| Created_tmp_tables      | 1     |
+-------------------------+-------+
3 rows in set (0.000 sec)
In the above example, the SQL server is not having to create temporary tables on disk. This is considered optimal.
Prune WordPress Database
Without intervention, WordPress will store junk/unused data in the database. Over time, this can add up causing database bloat and serious performance lags. This includes items such as:
- Post revisions
- Auto-saved drafts
- Trashed posts
- Trashed comments
- Comment spam
- Tables for plugins and themes that are no longer active or installed
- Transient records
In your wp-config.php file, add or edit the following setting to limit the number of post revisions saved to the database.
define('WP_POST_REVISIONS', 15);Many resources exist on the internet for dealing with these items.
Monitor Performance
It’s important to regularly monitor the performance of MariaDB and adjust the configurations as necessary. This includes monitoring CPU usage, memory usage, disk I/O, and query performance. Use a tool like mysqltuner to gain insights on the performance of the SQL installation, or enable Slowquery logging to identify long running queries.
Review Opcache Hit Rates and Stats
Opcache provides significant benefits when used with PHP-FPM. When a PHP file has been previously requested and there is enough opcache available, the script is already stored in memory. This allows for faster execution as it stands ready to accept data inputs without having to reload the file from disk. It is important to maximize Opcache Hits and minimize misses.
PHP provides several built-in functions to obtain information about OPcache status and configuration like opcache_get_status() and opcache_get_configuration(). Additionally, there are several web-based monitoring tools to visualize OPcache usage and performance. Some popular options include:
- OPcache GUI (https://github.com/amnuts/opcache-gui): A single-file PHP script that provides a simple and clean interface to monitor OPcache usage and performance.
- OCP (https://github.com/ck-on/ocp): A web-based OPcache control panel that allows you to monitor and manage OPcache settings in real-time.
- OPcache Status (https://github.com/rlerdorf/opcache-status): A one-page opcache status page for the PHP 5.5 opcode cache.
- CacheTool (https://github.com/gordalina/cachetool): CacheTool allows you to work with APCu, OPcache, and the file status cache through the CLI. It will connect to a FastCGI server (like PHP-FPM) and operate on its cache.
To use these tools, download and install them on your web server, following the instructions provided in their respective repositories. Keep in mind that some of the information displayed by these tools can reveal information about web server files, or other sensitive information about the website. It is best to keep these interfaces secured by IP, or another form of authentication.
When reviewing Opcache Statistics there are a few key items to look for and assess.
Opcache Hit Rate
The hit rate is the percentage of requests that are being served using cached opcode instead of parsing and compiling the scripts anew.
[opcache_hit_rate] => 90.64060820636The above hit rate suggests opcache requires more memory or resources to perform to its full capacity. A high hit rate close to 100 indicates that the cache is functioning effectively and providing the desired performance benefits. Monitoring the hit rate can help identify if adjustments to Opcache settings are necessary to improve its efficiency. The next section explains how to adjust the memory allocation for opcache.
Memory Consumption
Analyzing memory usage involves checking the amount of memory allocated to the OPCache and how much of it is being utilized.
[cache_full] => 1
[used_memory] => 134217720
[free_memory] => 8
[wasted_memory] => 0
[current_wasted_percentage] => 0
In the above output, the administrator would want to consider increasing the opcache.memory_consumption to a value higher than 128MB as the “cache_full” boolean is true and free_memory is at 8 bytes. This information helps determine if there is a need to increase or decrease the memory allocation, based on the size and complexity of your PHP scripts. Ensuring an appropriate memory allocation helps prevent cache evictions and promotes a more efficient use of server resources.
Both num_cached_keys and max_cached_keys are metrics that provide insight into the number of cached keys (compiled PHP scripts) currently stored in the OPCache (num_cached_keys) and the maximum number of cached keys allowed (max_cached_keys).
[num_cached_scripts] => 4371
[num_cached_keys] => 5597
[max_cached_keys] => 65407
[hits] => 114693
[start_time] => 1683575017
[last_restart_time] => 0
[oom_restarts] => 0
[hash_restarts] => 0
[manual_restarts] => 0
[misses] => 11843
[blacklist_misses] => 0
[blacklist_miss_ratio] => 0
[opcache_hit_rate] => 90.64060820636
By comparing these values, you can identify if the cache is nearing its capacity or if adjustments are needed to optimize the cache size. If num_cached_keys frequently approaches max_cached_keys, it may be beneficial to increase the opcache.max_accelerated_files value to accommodate more scripts, reducing cache evictions and further improving performance.
Regularly reviewing these key items can help you optimize the OPCache configuration, leading to improved website performance and reduced server resource usage.
Utilize NVMe Storage
As previously mentioned in the database optimization section, NVMe storage helps database server performance by providing significantly faster data access and reduced latency compared to traditional storage solutions. This results in quicker response times and more efficient query processing, leading to improved overall server performance.
NVMe storage improves server performance for WordPress websites in several ways:
Faster Page Load Times
With its high-speed data transfer and low latency, NVMe storage allows for quicker access to website files and assets, such as images, stylesheets, and scripts. This leads to faster page load times and a better user experience.
Improved Database Performance
The benefits of using NVMe storage when processing database queries can be outlined as follows:
- When processing queries, the database relies on both cached and uncached MySQL data, requiring interaction with the operating system to retrieve the necessary information.
- If the operating system has ample RAM, the files needed for a query might already be stored in RAM rather than only being available on a persistent storage device.
- In cases where data must be accessed from a storage device, an NVMe drive provides significantly faster data retrieval compared to a SATA SSD, while traditional HDDs are much slower and typically not used in such scenarios anymore.
Overall, using NVMe storage greatly enhances database query performance due to its rapid data access capabilities.
Enable Brotli and Gzip Compression
Compressing web server responses with Brotli or Gzip can significantly improve website performance by reducing the amount of data transferred over the network. This provides a final stage of optimization on the response being returned from the Origin Server. On average, Gzip compression can reduce the size of web content by 60-70%, while Brotli tends to provide even better compression rates, often reducing content size by 70-80%.
Enabling Brotli compression within NGINX is accomplished through the use of the brotli nginx module. The module can be compiled and installed alongside NGINX and loaded dynamically.
Analyze a Server Response for Compression
To determine if a request response was compressed with Brotli or Gzip compression, you can use Chrome or Firefox Developer Tools to review the Content-Encoding header – follow these steps:
- Open the developer tools in your browser:
– In Chrome, press Ctrl + Shift + I (Windows/Linux) or Cmd + Opt + I (Mac).
– In Firefox, press Ctrl + Shift + I (Windows/Linux) or Cmd + Opt + I (Mac).
– Or right click on the webpage and select Inspect. - Click on the “Network” tab in the developer tools.
- Refresh the webpage or initiate the action you want to analyze. This will populate the network panel with a list of requests made by the browser.
- Find the request you’re interested in, such as the main document request or a specific resource like a CSS or JavaScript file. Click on the request to open the detailed view.
- In the detailed view, look for the Headers tab (this should be the default tab in both browsers). Scroll down to the Response Headers section.
- Check the value of the Content-Encoding header. If the response is compressed with Gzip, it will display
gzip, and if it’s compressed with Brotli, it will displaybr. If the header is absent or has a different value, the response is not compressed using either of these algorithms.
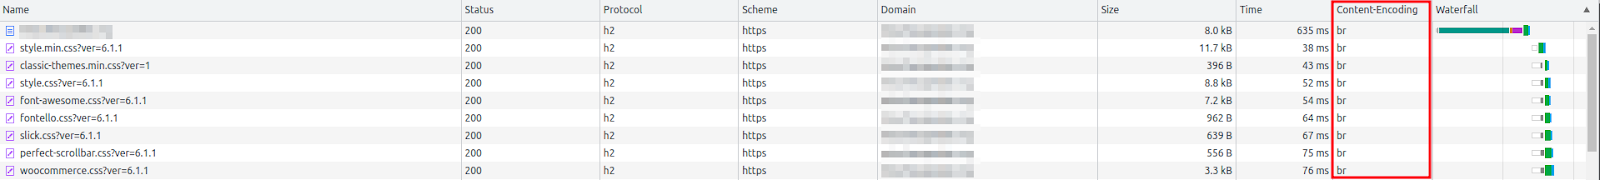
By examining the Content-Encoding header in the developer tools, you can quickly determine if a request response was compressed with Brotli or Gzip.
NGINX Proxy Caching
Serving requests from the Nginx cache can result in significant performance improvements, as it eliminates the need for the request to traverse the entire stack and access the backend services. This can lead to reduced processing times and improved response times, resulting in a better user experience.
According to benchmarks, serving requests from the Nginx cache can result in a 90% reduction in response times compared to requests that traverse the entire stack. This is due to the caching mechanism’s ability to serve requests directly from memory or disk, reducing the time taken to process the request.
Furthermore, serving requests from the Nginx cache can significantly reduce server load and improve scalability. By reducing the number of requests that must be handled by backend services like PHP-FPM or MySQL, the server can handle more requests concurrently, leading to improved performance and faster response times. This is essential for a high traffic website.
Our UltraStack NGINX configuration adds an X-Proxy-Cache HTTP header to responses and the Upstream Cache Status to nginx access log entries. The following three techniques explain how to identify whether the page being received is a cached version served by NGINX:
- Using cURL: make a simple GET request to the URL in question, and use grep to check the X-Proxy-Cache header.
$ curl -is https://gonintesto.com/ | grep X-Proxy-Cache
X-Proxy-Cache: HIT- Using Chrome DevTools: Headers can also be easily inspected using the Chrome DevTools. Use F12 or Ctrl+Shift+I to bring up the DevTools window, then click the Network tab. Tick the box that says “Disable cache”, which will bypass Chrome’s internal cache, then reload the page to capture all of the network information (not disabling Chrome’s cache will allow you to see 304 Not Modified responses for static assets, which shows how the client-side cache is working). The following are the possible values for $upstream_cache_status:
- MISS – The response was not found in the cache and so was fetched from an origin server. The response might then have been cached.
- BYPASS – The response was fetched from the origin server instead of served from the cache because the request matched a
proxy_cache_bypassdirective. - EXPIRED – The entry in the cache has expired. The response contains fresh content from the origin server.
- STALE – The content is stale because the origin server is not responding correctly, and
proxy_cache_use_stalewas configured. - UPDATING – The content is stale because the entry is currently being updated in response to a previous request, and
proxy_cache_use_staleupdating is configured. - REVALIDATED – The
proxy_cache_revalidatedirective was enabled and NGINX verified that the current cached content was still valid (If-Modified-SinceorIf-None-Match). - HIT – The response contains valid, fresh content direct from the cache.
- Using NGINX access log: Connect to the server using SSH and read the access log with a tail or cat.
[root@vps87640 ~]# tail -f /var/log/nginx/access.log
173.231.218.25 - - [16/Mar/2023:21:50:43 -0400] "GET / HTTP/2.0" 200 8205 "-" "Mozilla/5.0 (X11; Linux x86_64) AppleWebKit/537.36 (KHTML, like Gecko) Chrome/111.0.0.0 Safari/537.36" [rt=0.000] [proto=HTTP/2.0:h2] [args=-] [ucs=HIT] [xpc=HIT] [uct=-] [gz=-] [tls=TLSv1.3] [cipher=TLS_AES_256_GCM_SHA384] [scheme=https] gonintesto.com gonintesto.com vps87640.inmotionhosting.com 1638
The value assigned to ucs= (HIT in the above example) or the “Upstream Cache Status” will be one of the above cache statuses.
Using Platform InMotion’s Manage Server tools, here is how you would enable NGINX proxy cache on your site:
With NGINX proxy cache configured, you may use our UltraStack Utilities to determine the cache HIT rates for all requests to NGINX.
CT-92204 /# usutil
INFO: Parsing log '/var/log/nginx/access.log' (15.4 MiB)...

CACHE STATUS
+----------------+--------------+-----------------+
| HIT (Dynamic)  | HIT (Static) | DISABLED+BYPASS |
+----------------+--------------+-----------------+
| 146323 (51.8%) |   0 (0.0%)   |   4096 (1.4%)   |
+----------------+--------------+-----------------+
+----------------+----------------+-------------+-------------+----------+
|      HIT       |      MISS      |    BYPASS   |   EXPIRED   | UPDATING |
+----------------+----------------+-------------+-------------+----------+
| 146323 (51.0%) | 110858 (38.7%) | 4096 (1.4%) | 3095 (1.1%) | 9 (0.0%) |
+----------------+----------------+-------------+-------------+----------+
+-------------+-------------+----------+-----------------+
| STATIC/TYPE | STATIC/PATH | DISABLED |      TOTAL      |
+-------------+-------------+----------+-----------------+
|   0 (0.0%)  |   0 (0.0%)  | 0 (0.0%) | 286663 (100.0%) |
+-------------+-------------+----------+-----------------+
While this is a tool specific to InMotion Hosting, the information can be retrieved using the third party NGINX module, nginx-module-vts.
In summary, using NGINX proxy cache will help drive performance for high traffic websites.
Use TLSv1.3 and HTTP/2
TLS (Transport Layer Security) is a cryptographic protocol that provides secure communication between web clients and servers. TLS 1.3 is the latest version of the TLS protocol and is designed to provide faster and more secure communication compared to previous versions.
TLS 1.3 also introduces several new features that improve website performance, such as 0-RTT (Zero Round Trip Time) handshakes, which allows returning visitors to establish a secure connection more quickly. Additionally, TLS 1.3 reduces the number of round trips required to establish a secure connection, which reduces latency and improves website performance.
Here are two ways to determine if an NGINX web server is using TLS 1.3:
- Using the NGINX access log: In the NGINX access log, look for requests that were made over HTTPS (port 443) and check the TLS protocol version used by the client. If the client and server are using TLS 1.3, the access log will show the protocol version as “TLSv1.3”. For example, a log entry for a request using TLS 1.3 might look like this:
1.2.3.4 - - [27/Mar/2023:11:12:13 +0000] "GET / HTTP/1.1" 200 1234 "-" "Mozilla/5.0 (Windows NT 10.0; Win64; x64) AppleWebKit/537.36 (KHTML, like Gecko) Chrome/123.4.5.6 Safari/537.36" "TLSv1.3".https://nginx.org/en/docs/http/ngx_http_ssl_module.html#variables
- Using an SSL/TLS Checker: To determine if an NGINX server is using TLS 1.3 using an SSL/TLS checker, run a test on the server using the checker tool, such as SSL Labs’ SSL Server Test or Qualys SSL Labs SSL Server Test. The tool will analyze the server’s SSL/TLS configuration and provide information about the TLS protocol being used, including whether TLS 1.3 is enabled. The report generated by the tool will also provide details about the server’s SSL/TLS configuration, including any issues or vulnerabilities that were found.
Configure NGINX: To set the ssl_protocols parameter in the NGINX configuration, open the /etc/nginx/nginx.conf file and locate the ssl_protocols parameter in the http block, then set the desired SSL/TLS protocols (e.g., ssl_protocols TLSv1.2 TLSv1.3;) and save the file. Finally, test the configuration using nginx -t and reload the nginx service using systemctl reload nginx.
https://nginx.org/en/docs/http/ngx_http_ssl_module.html#ssl_protocols
HTTP/2 is the latest version of the HTTP protocol that powers the web. It is designed to improve website performance by reducing latency and enabling faster page load times. HTTP/2 achieves this by introducing several new features, including multiplexing, header compression, and server push.
There are a few ways to determine if an NGINX web server is using HTTP/2:
- Check the response headers: When a client makes a request to an NGINX server, the server responds with headers that include information about the protocol being used. If HTTP/2 is being used, the response headers will include the string “HTTP/2” in the “server” field. For example, the “server” field may read “nginx/1.20.1 (Ubuntu) HTTP/2”.
- Use a browser developer tool: Another way to determine if an NGINX server is using HTTP/2 is to use a browser developer tool, such as Chrome DevTools or Firefox Developer Tools. When the tool is open and a page is loaded from the NGINX server, the “protocol” column in the network tab will show “h2” if HTTP/2 is being used. If HTTP/1.x is being used, the protocol column will show “http/1.1”.
Configure NGINX: To configure NGINX to use HTTP/2, you need to ensure that your NGINX version supports HTTP/2 and then enable it by adding the http2 parameter to the listen directive in the server configuration file, and also include an SSL certificate. For example, the directive listen 443 ssl http2; would enable HTTP/2 over SSL on port 443.
http://nginx.org/en/docs/http/ngx_http_v2_module.html
Increase Server Resources
While the exact amount depends on the specific workload of the website, a minimum of 4GB and 2 vCPU cores is recommended when benchmarking your resource needs on a high traffic website. In a high-performance server running MySQL, Redis, PHP-FPM, Apache, and NGINX, having enough RAM is critical to allow each service’s caching techniques to work at their full potential.
These services use RAM to cache frequently accessed data and reduce the time taken to retrieve it from disk or other storage devices. If the server does not have enough RAM, the caching will not be as effective, leading to longer processing times and slower website performance.
For instance, MySQL uses the InnoDB buffer pool to cache frequently accessed data from the database, and Redis uses memory to store frequently accessed data in key-value pairs. PHP-FPM uses opcache to cache PHP scripts, and NGINX uses RAM to cache frequently requested web pages and assets.
If the server does not have sufficient RAM, these caching techniques will not be as effective, and the server may resort to swapping data in and out of slower storage devices, leading to slower response times and reduced server capacity.
Swap Usage
To determine if a Linux server is swapping, you can use the free command to view the system’s memory usage. If the “Swap” value is greater than zero, it indicates that the server is currently using swap space to store data in memory.
# free
              total        used        free      shared  buff/cache   available
Mem:        3145728      258388     1784700       36848     1102640     2850492
Swap:             0           0           0
Additionally, you can use the vmstat command to monitor the amount of swapping activity occurring on the server, with the “si” and “so” values indicating the amount of memory being swapped in and out, respectively.
# vmstat
procs -----------memory----------   ---swap-- -----io---- -system-- ------cpu-----
 r  b   swpd   free   buff  cache   si   so    bi    bo   in   cs us sy id wa st
 1  0      0 1782348      0 1102660    0    0    16    14    0    0  4  3 93  0  0
The above server does not use Swap and is not swapping.
OOM Kills
To determine if a Linux server is experiencing OOM (Out of Memory) kills, you can check the system logs for messages related to OOM events. On most Linux distributions, the system log file is located at /var/log/messages or /var/log/syslog.
To view OOM-related messages, you can search for the keyword “OOM” using the grep command:
# grep -i "OOM" /var/log/messages
May  8 01:22:35 vps53534 kernel: mysqld invoked oom-killer: gfp_mask=0x201da, order=0, oom_score_adj=-1000
If OOM events are occurring, you will see log entries that indicate which process or application was killed by the OOM killer. Additionally, you can use tools like dmesg and journalctl to view kernel messages related to OOM events.
By having enough RAM on the server, each service can utilize caching techniques to their fullest extent, resulting in faster processing times, reduced disk usage, and an overall better user experience.
Caching Explained with Implementation Techniques
Browser Caching
ETags
The ETag (or entity tag) HTTP response header that web servers and browsers use to determine whether a resource in the browser’s local cache matches the one on the origin server.
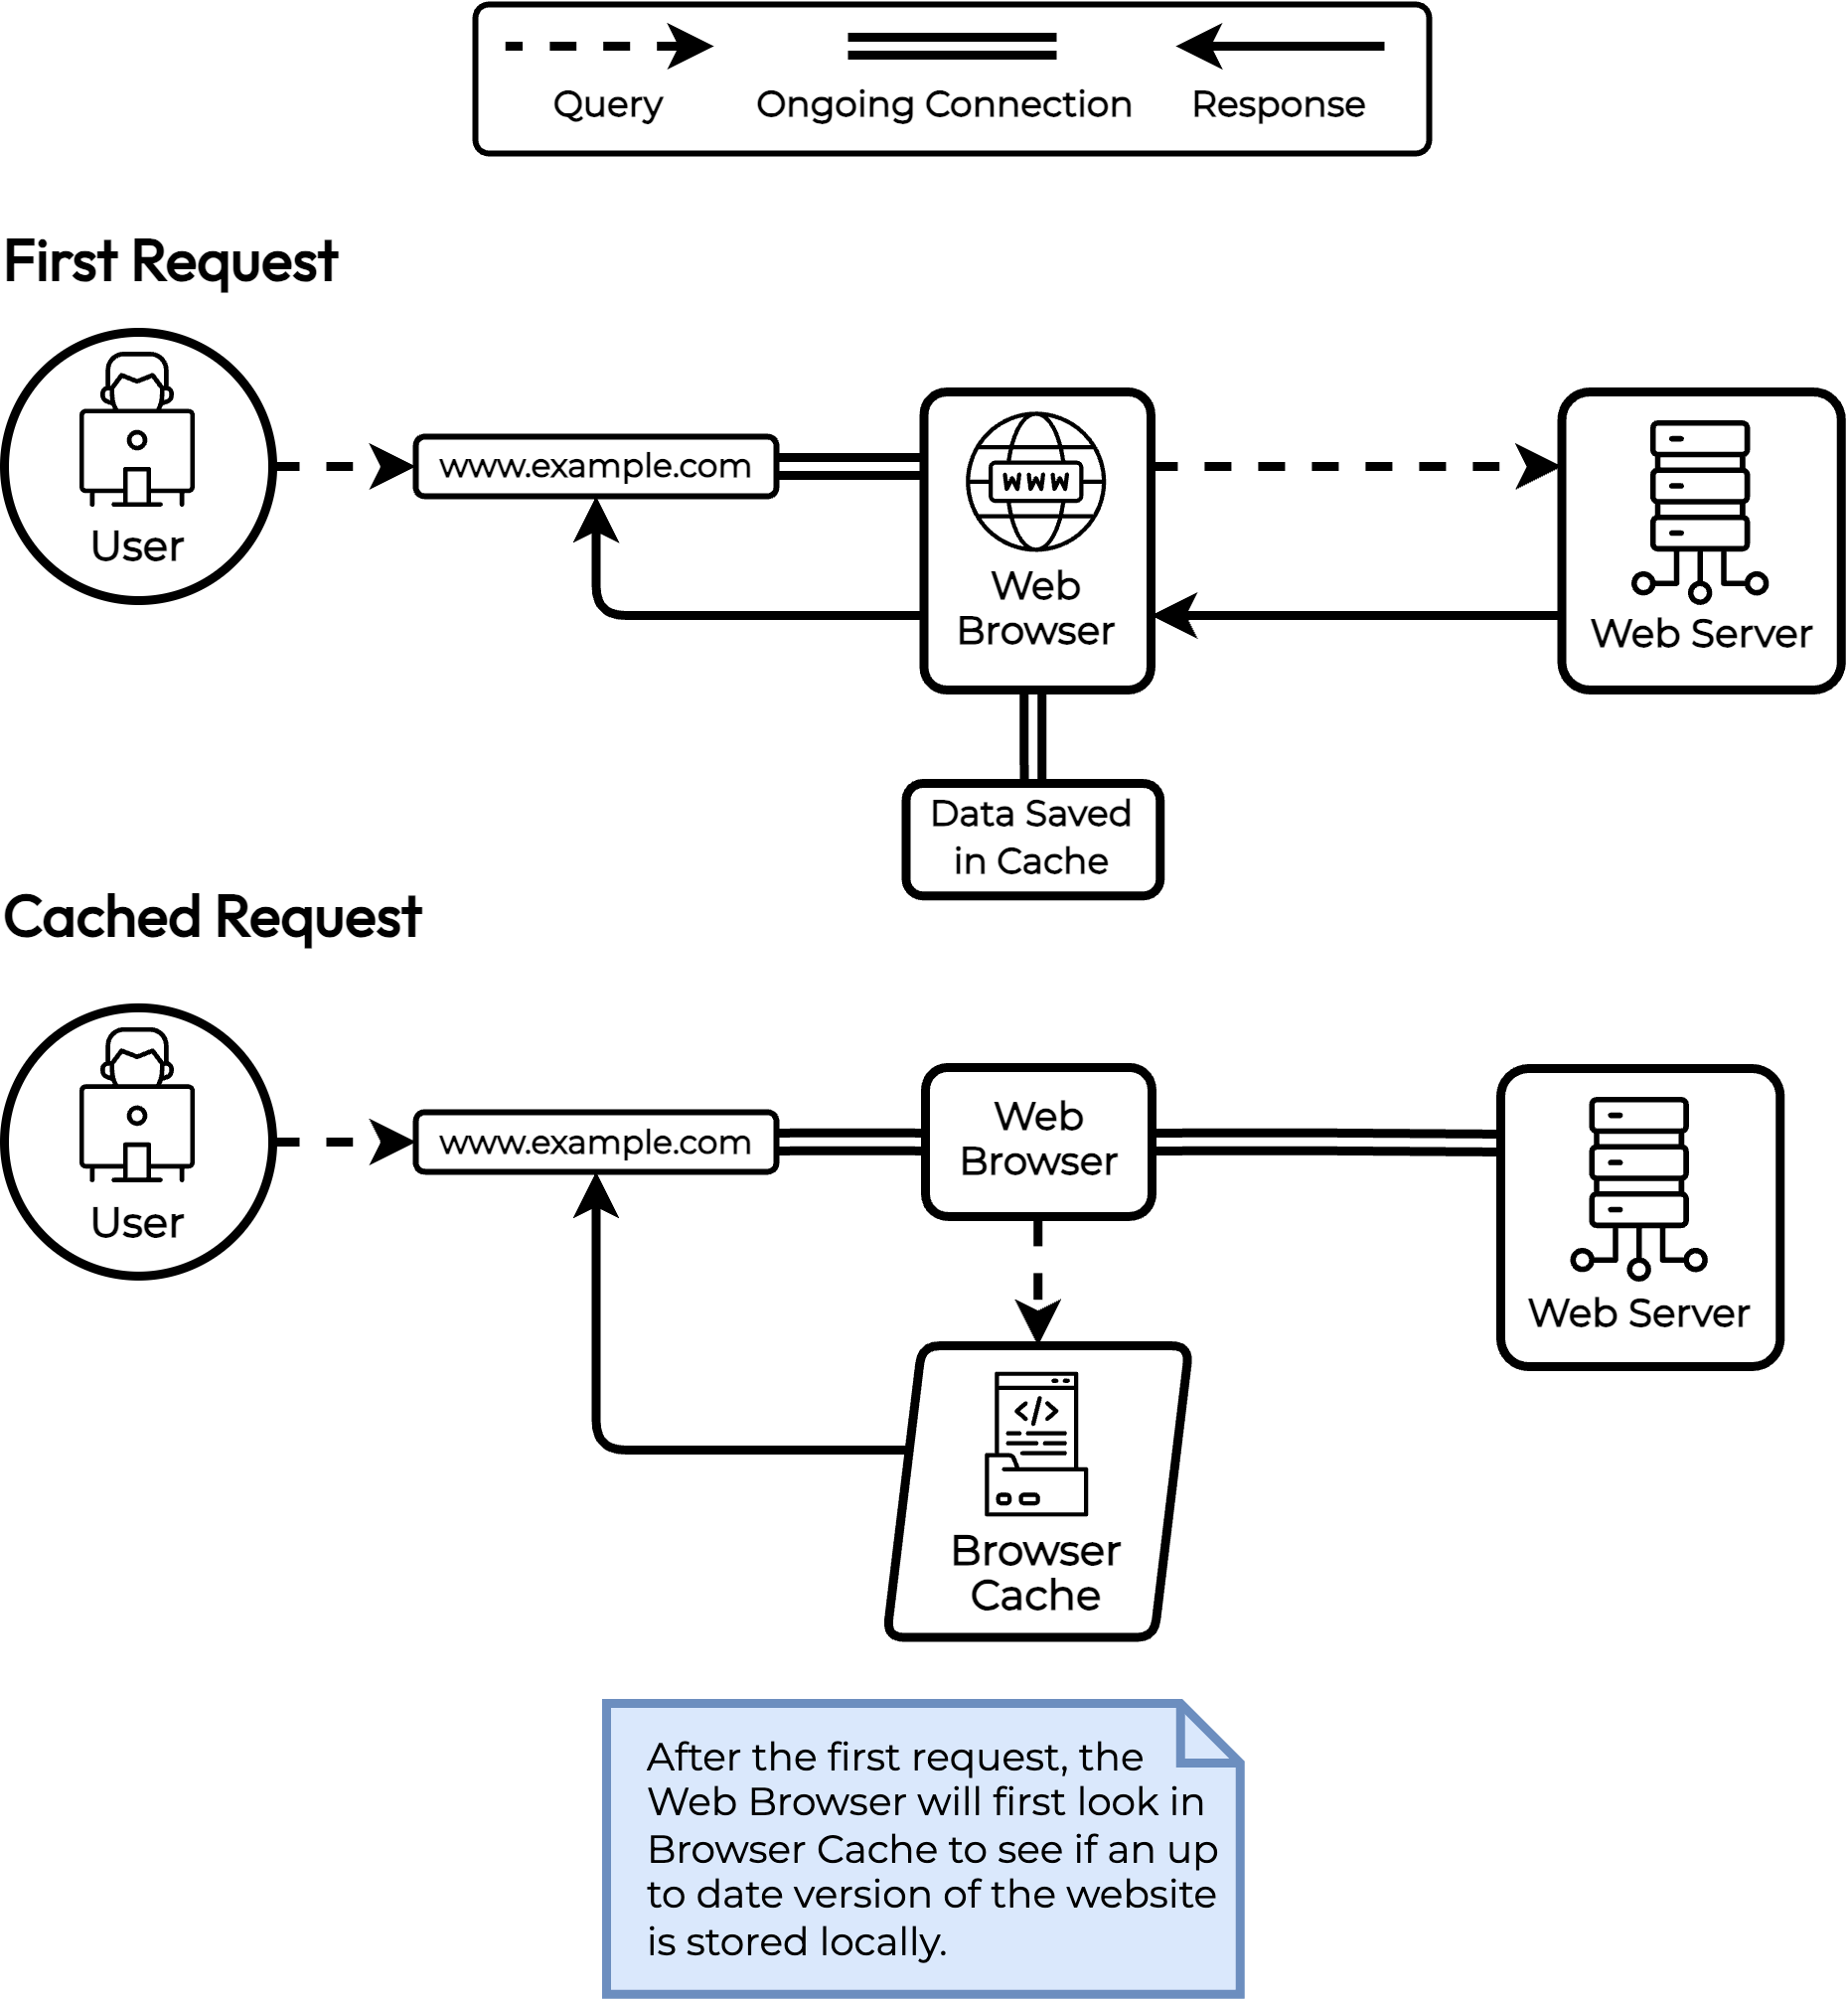
When a user revisits a site, one of two things happen:
- Display content to the user in the browser it if is within the allowable cache freshness time – Time to Live (TLL).
- If content is out of its cache time (TTL expired) then:
- If it has an Etag then it will need to send an Etag to the resolved URL to see if it needs to refresh.
- If it gets the matching Etag, then it will keep the content it has (no new downloading of content) and set the existing content’s TTL into the future which makes it a viable cached content for the TTL.
- If it gets a different Etag then it will trigger a fresh download of the new content.
- If it does not have an Etag then it will send a request out to get the potentially new content and will download that content regardless of if it really is new or not.
- If it has an Etag then it will need to send an Etag to the resolved URL to see if it needs to refresh.
It is important to note that the Etag request and response is much, much smaller than a download of content. As most websites do not change between TTLs, the TTLs need to be low “just in case” the site does change, therefore the Etag process is much more efficient than TTLs by themselves.
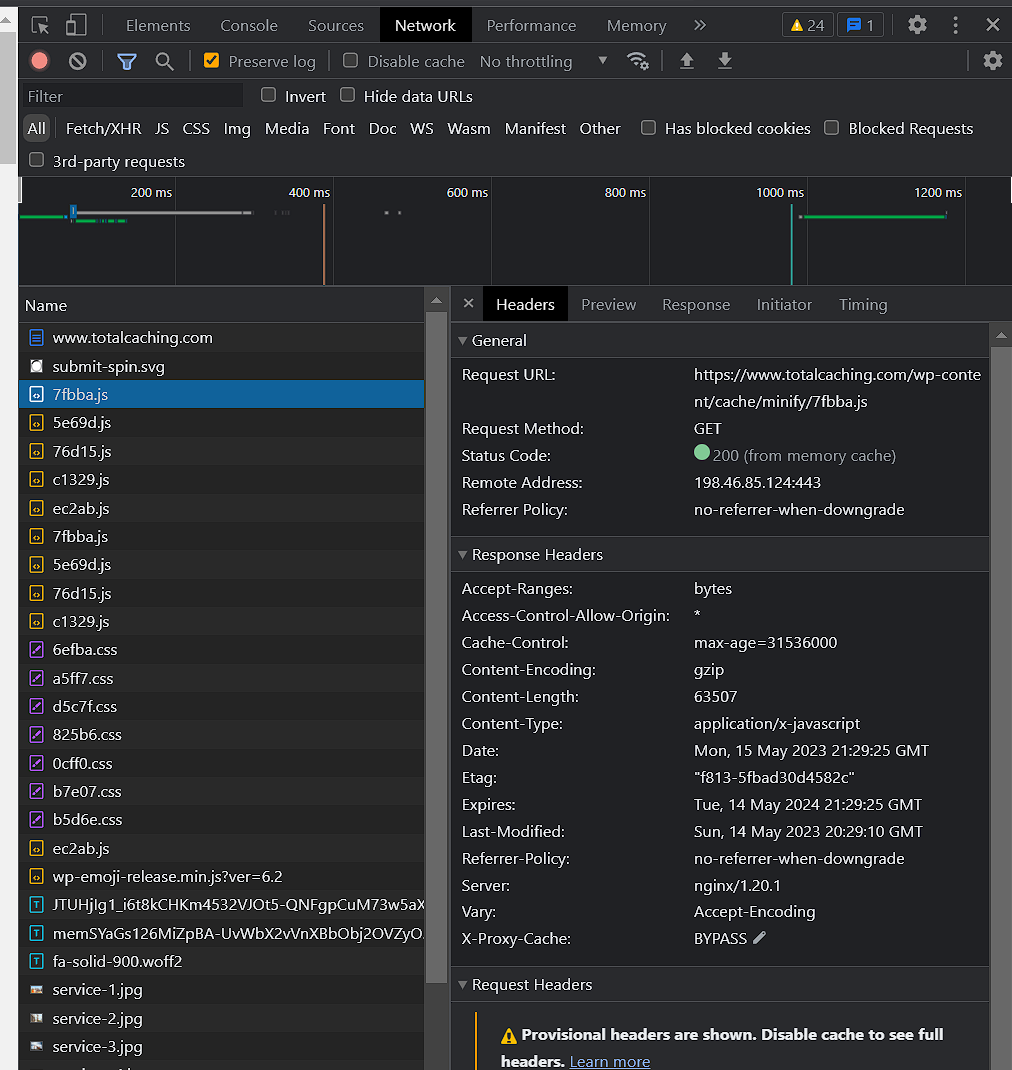
How to Check if Your Server Responds is Using ETags
- Open the developer tools in your browser:
– In Chrome, press Ctrl + Shift + I (Windows/Linux) or Cmd + Opt + I (Mac).
– In Firefox, press Ctrl + Shift + I (Windows/Linux) or Cmd + Opt + I (Mac).
– Or right click on the webpage and select Inspect. - Click on the Network tab in the developer tools.
- Refresh the webpage or initiate the action you want to analyze. This will populate the network panel with a list of requests made by the browser.
- Locate a specific resource like a CSS or JavaScript file. Click on the request to open the detailed view.
- In the detailed view, look for the Headers tab (this should be the default tab in both browsers).
- Scroll down to the Response Headers section for the selected file and check for the presence of an Etag.
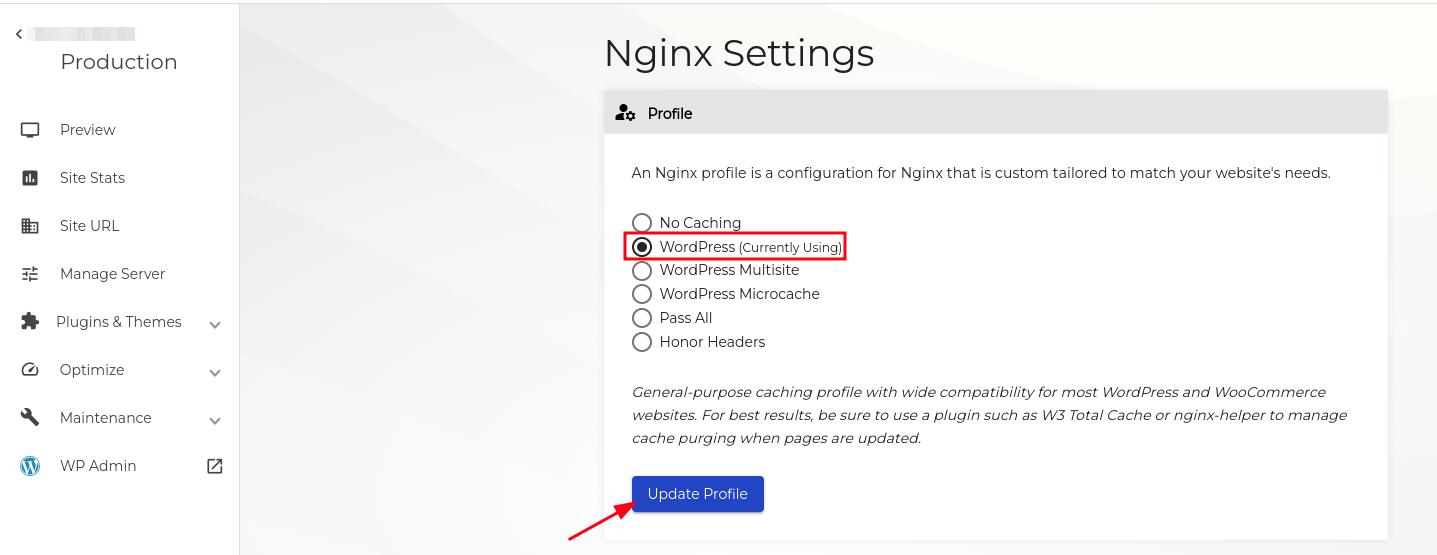
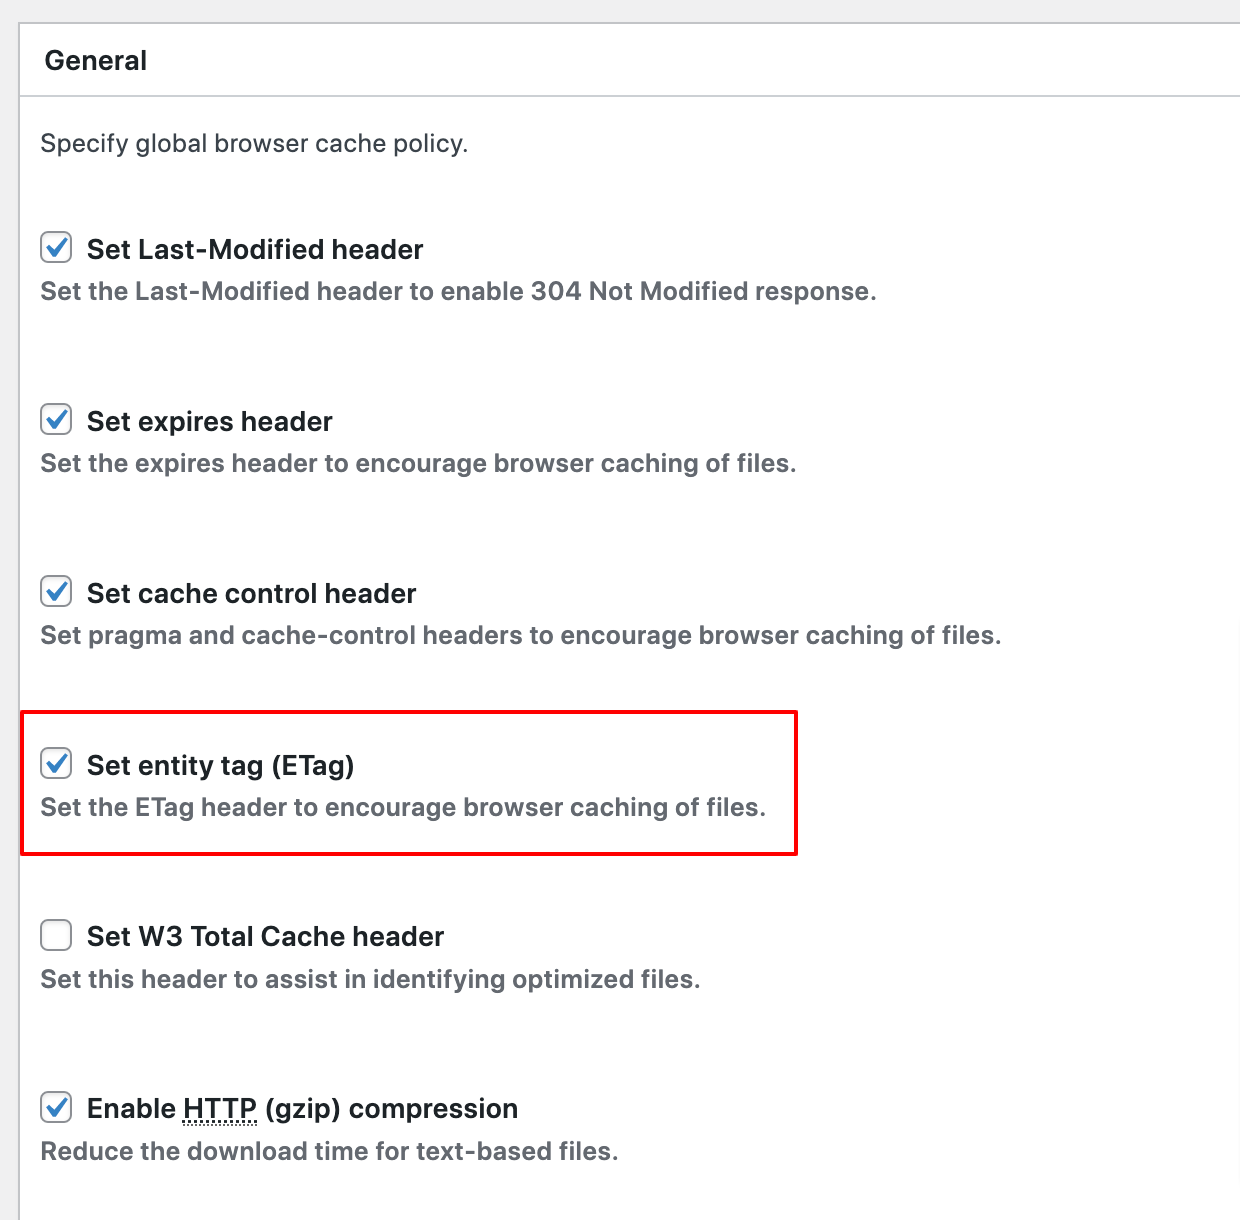
How to Configure ETags in W3 Total Cache
- In your WordPress admin dashboard, navigate to Performance > Browser Cache.
- Scroll down to the General section.
- Check the box next to the “Set entity tag (ETag)” setting.

- On the same page, using the method above, you can also enable or disable ETags for specific files types, including:
– CSS & JS
– HTML & XML
– Media & Other Files - Press the Save Settings & Purge Caches button within each respective settings box to save and apply the caching changes immediately.
Time To Live (TTL)
The Time To Live (TTL) value is the time that an object is stored in a caching system before it’s deleted or refreshed. In the context of CDNs, TTL typically refers to content caching, which is the process of storing a copy of your website resources (e.g., images, text, Javascript) on CDN proxies to improve page load speed and reduce origin server bandwidth consumption.
TTLs are used for caching purposes, and the value is stored in seconds. If the TTL value is set to a low number like 3600 seconds, the data will be stored in the cache for one hour. After one hour, a new version of the data needs to be retrieved.
If the TTL value is set to a high number like 86400 seconds, the data will be stored in the cache for 24 hours.
High TTL values cache your data longer, and lessen the frequency for retrieving new data. This gives your website a performance boost by reducing the server’s load, which improves the user’s experience.
TTL Policies for Static and Dynamic Content
Before you set your cache TTL policies, you need to consider the types of content you have: static and dynamic.
Static files like images and PDFs do not change frequently, so these should have a long TTL policy. This ensures that these files are cached for a longer period of time.
Dynamic content (e.g. CSS, HTML, database driven content) is updated on a frequent basis, so these resources need to be set accordingly. Dynamic content will have varying TTL policies, whether that’s a few minutes, seconds, or none at all.
Setting TTL Policies in W3 Total Cache
- In your WordPress admin dashboard, navigate to Performance > Page Cache.
- Scroll down to the Advanced section.
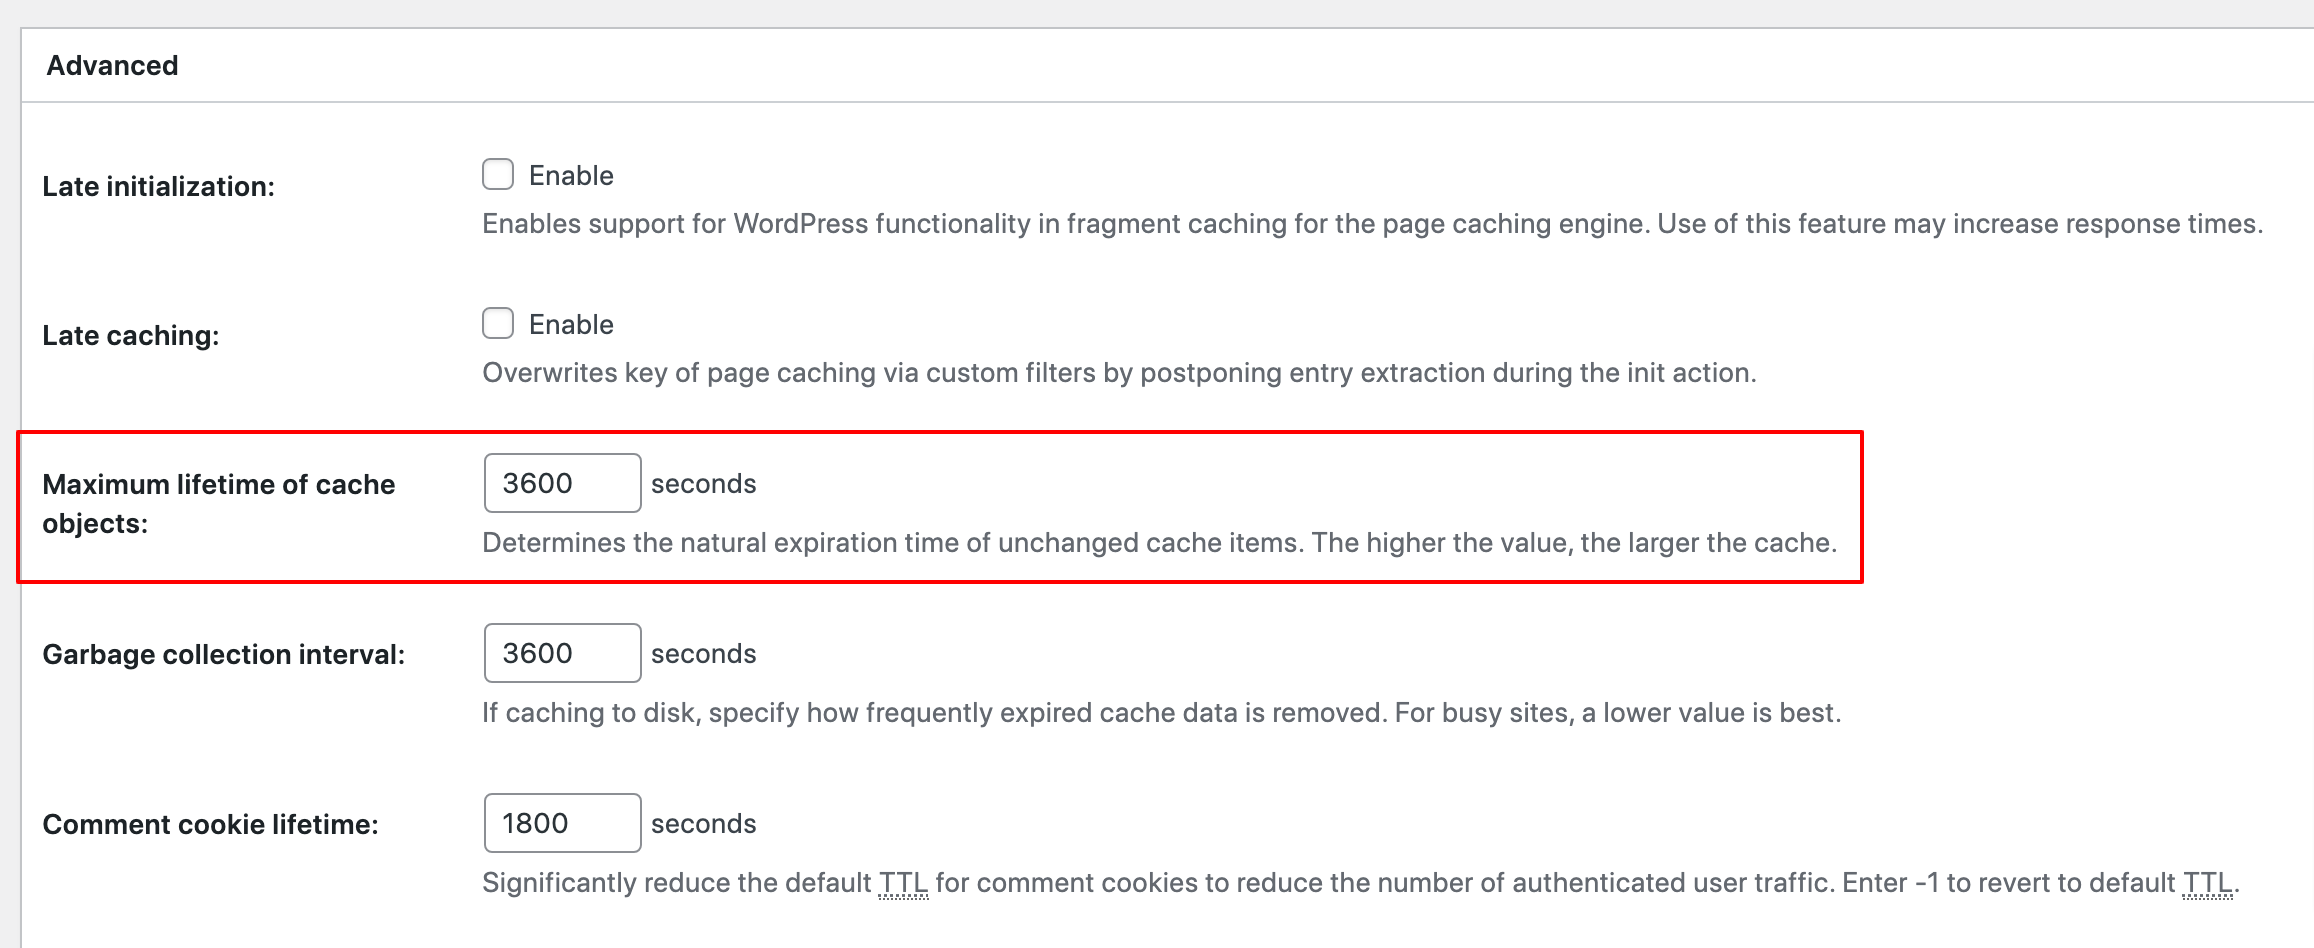
- Locate the “Maximum lifetime of cache objects:” setting and set the max-age length.
- Scroll down to the bottom and press the Save Settings & Purge Caches button to save and apply the settings immediately.
HTTP Cache-Control Headers
- Cache-Control: Max-Age
- The max-age directive specifies the maximum amount of time that a resource can be cached by a client or a proxy server. After expiring, a browser must refresh its version of the resource by sending another request to a server.
- cache-control: max-age=3600 means that the returned resource is valid for one hour, after which the browser has to request a newer version.
- Cache-Control: No-Cache
- The no-cache directive tells a browser or caching server not to use the cached version of a resource, and to request a new version of the resource from the origin server.
- Cache-Control: No-Store
- The no-store directive tells browsers to never store a copy of the resource and not to keep it in cache. This setting is usually used for sensitive information like credit card numbers, and ensures PCI compliance by not storing this type of data in the cache.
- Cache-Control: Public
- The public response directive indicates that a resource can be cached by any cache. This directive is useful for resources that change infrequently, and when the resource is intended for public consumption.
- Cache-Control: Private
- The private response directive indicates that a resource is user specific – it can still be cached, but only on a client device. For example, a web page response marked as private can be cached by a browser, but not a Content Delivery Network.
- This directive can be used in conjunction with the max-age directive to specify how long the resource can be cached before it needs to be revalidated.
Setting HTTP Cache-Control Headers in W3 Total Cache
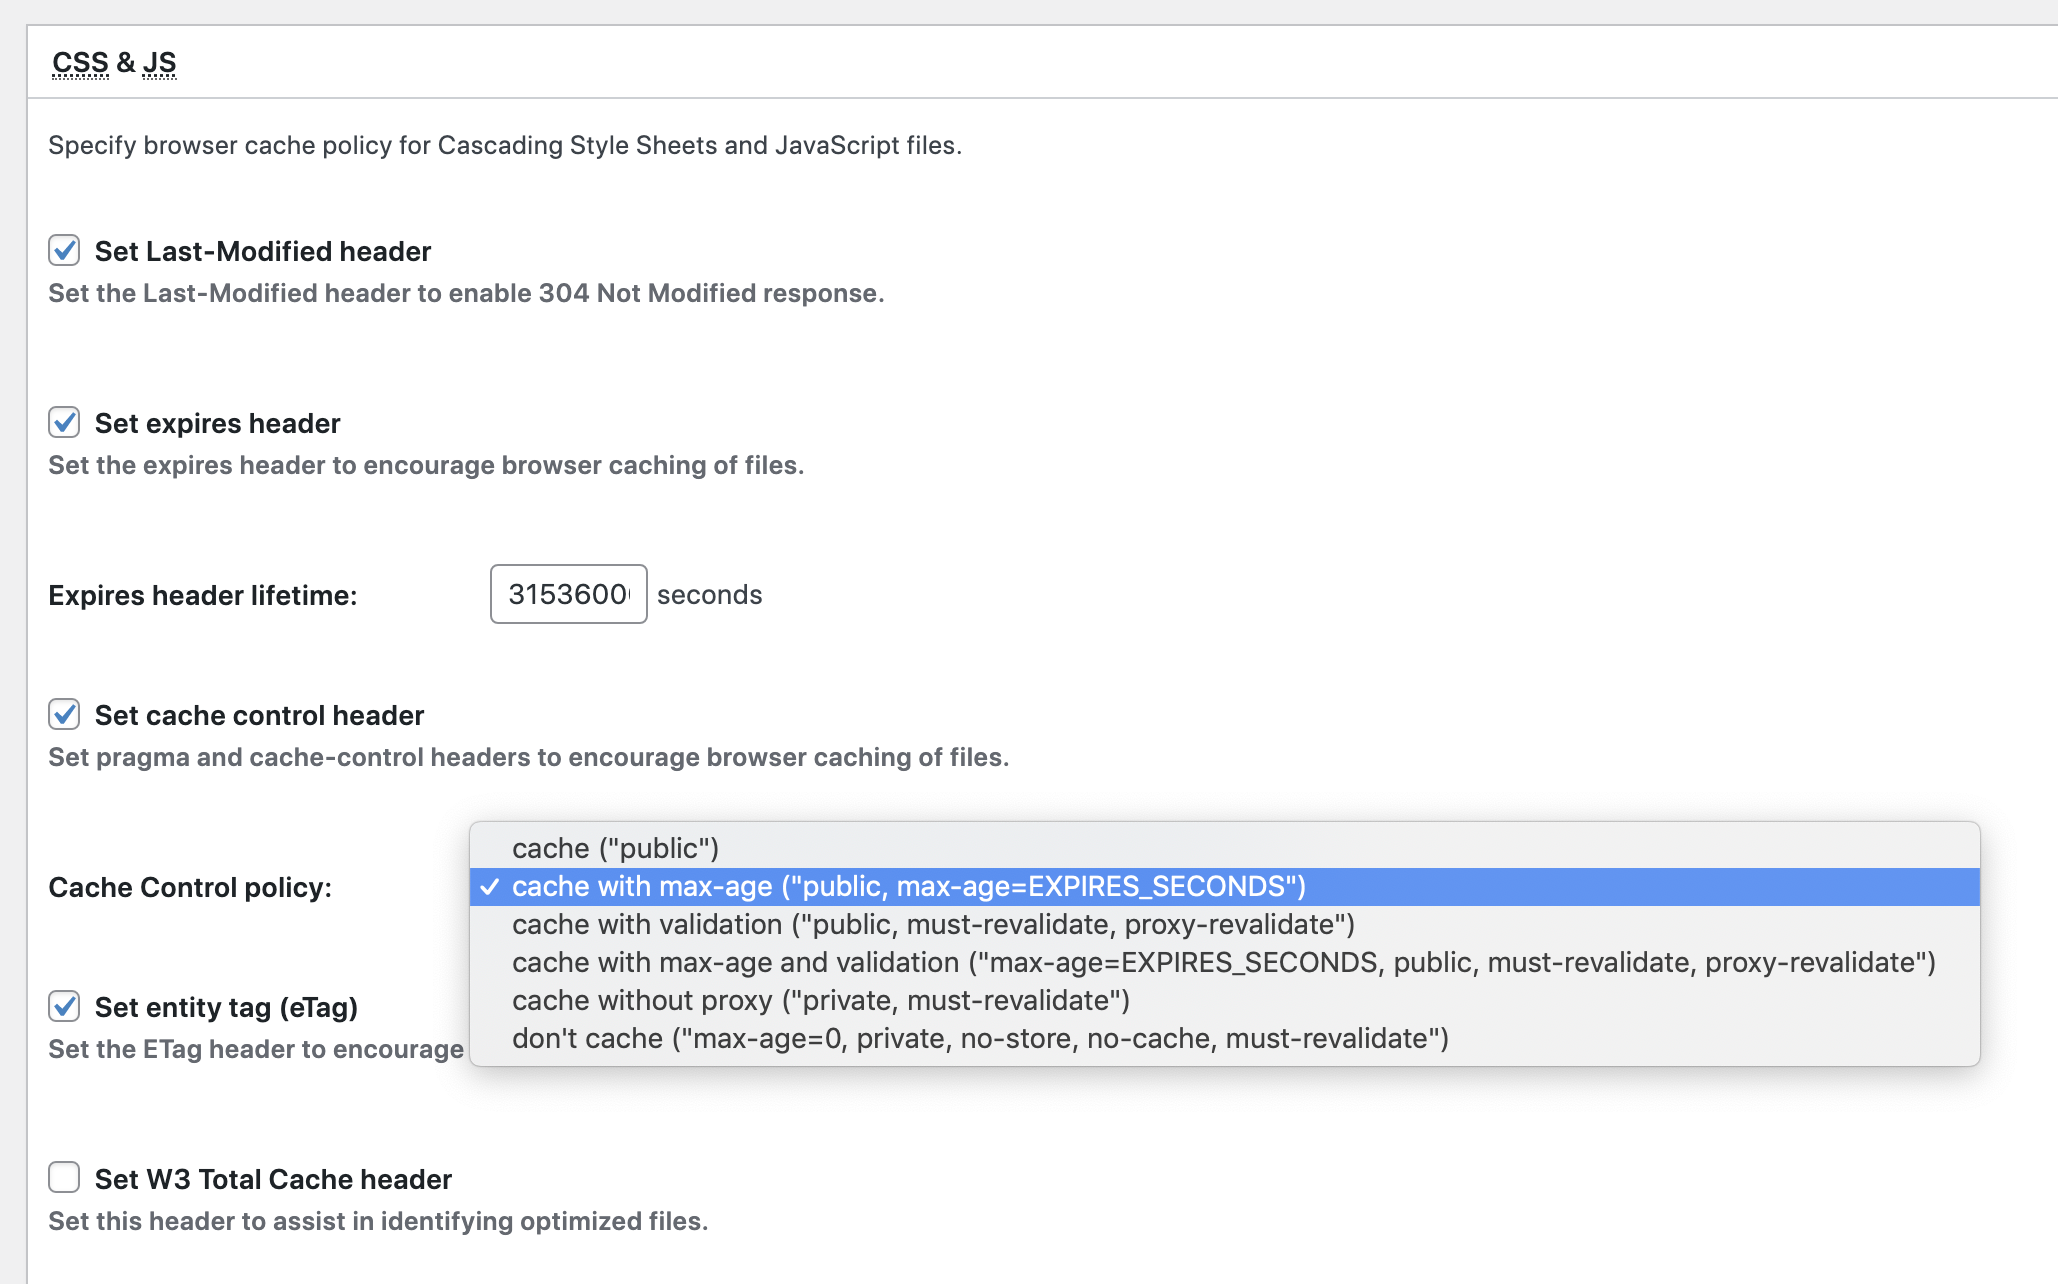
- In your WordPress admin dashboard, navigate to Performance > Browser Cache.
- Determine what your Cache-Control policies will be for the following files:
– CSS & JS
– HTML & XML
– Media & Other Files - Locate the CSS & JS section.
- Check the box next to the “Set cache control header” setting.
- Below that option, select the “Cache Control policy:” from the selections provided.
- Locate the HTML & XML section.
- Check the box next to the “Set cache control header” setting.
- Below that option, select the “Cache Control policy:” from the selections provided.
- Locate the Media & Other Files section.
- Check the box next to the “Set cache control header” setting.
- Below that option, select the “Cache Control policy:” from the selections provided.
- Scroll down to the bottom and press the Save Settings & Purge Caches button to save and apply the settings immediately.
Cache Busting
Cache busting is a technique used to force a browser or caching server to retrieve a new version of a resource, rather than using the cached version. One way to do this is by using a query parameter, such as a timestamp or a version number, in the URL of the resource.
For example, instead of requesting a resource at the URL https://www.example.com/styles.css, a cache-busting URL would look like https://www.example.com/styles.css?v=1234, where v=1234 is the query parameter. This query parameter can be a timestamp or a version number, and it will be ignored by the server, but it will force the browser or caching server to treat the request as a new request, rather than using the cached version of the resource.
This technique is often used for static resources like stylesheets, scripts, images and so on, that are intended to be cached, but that may need to be updated frequently. By appending a query parameter to the URL, a new version of the resource will be retrieved each time the query parameter changes.
This technique is commonly used to ensure that the client gets the latest version of the resources after they are updated on the server side.
Enable Cache Busting in W3 Total Cache
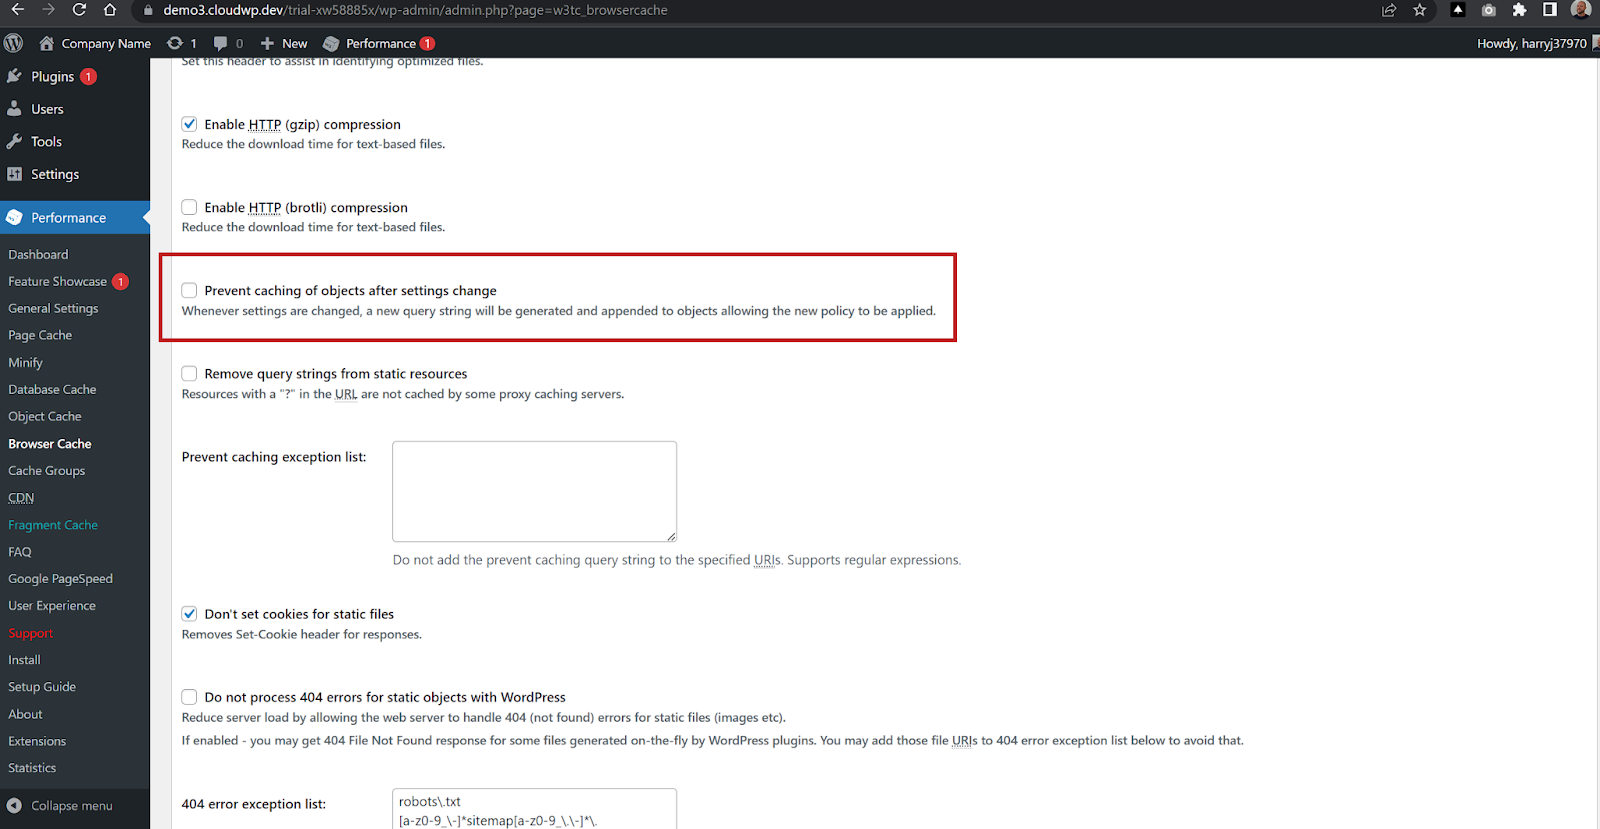
Enabling Cache Busting in W3 Total Cache is done by selecting the option “Prevent caching of objects after settings change” under Performance > Browser Cache. This adds a random string at the end of static asset URLs.
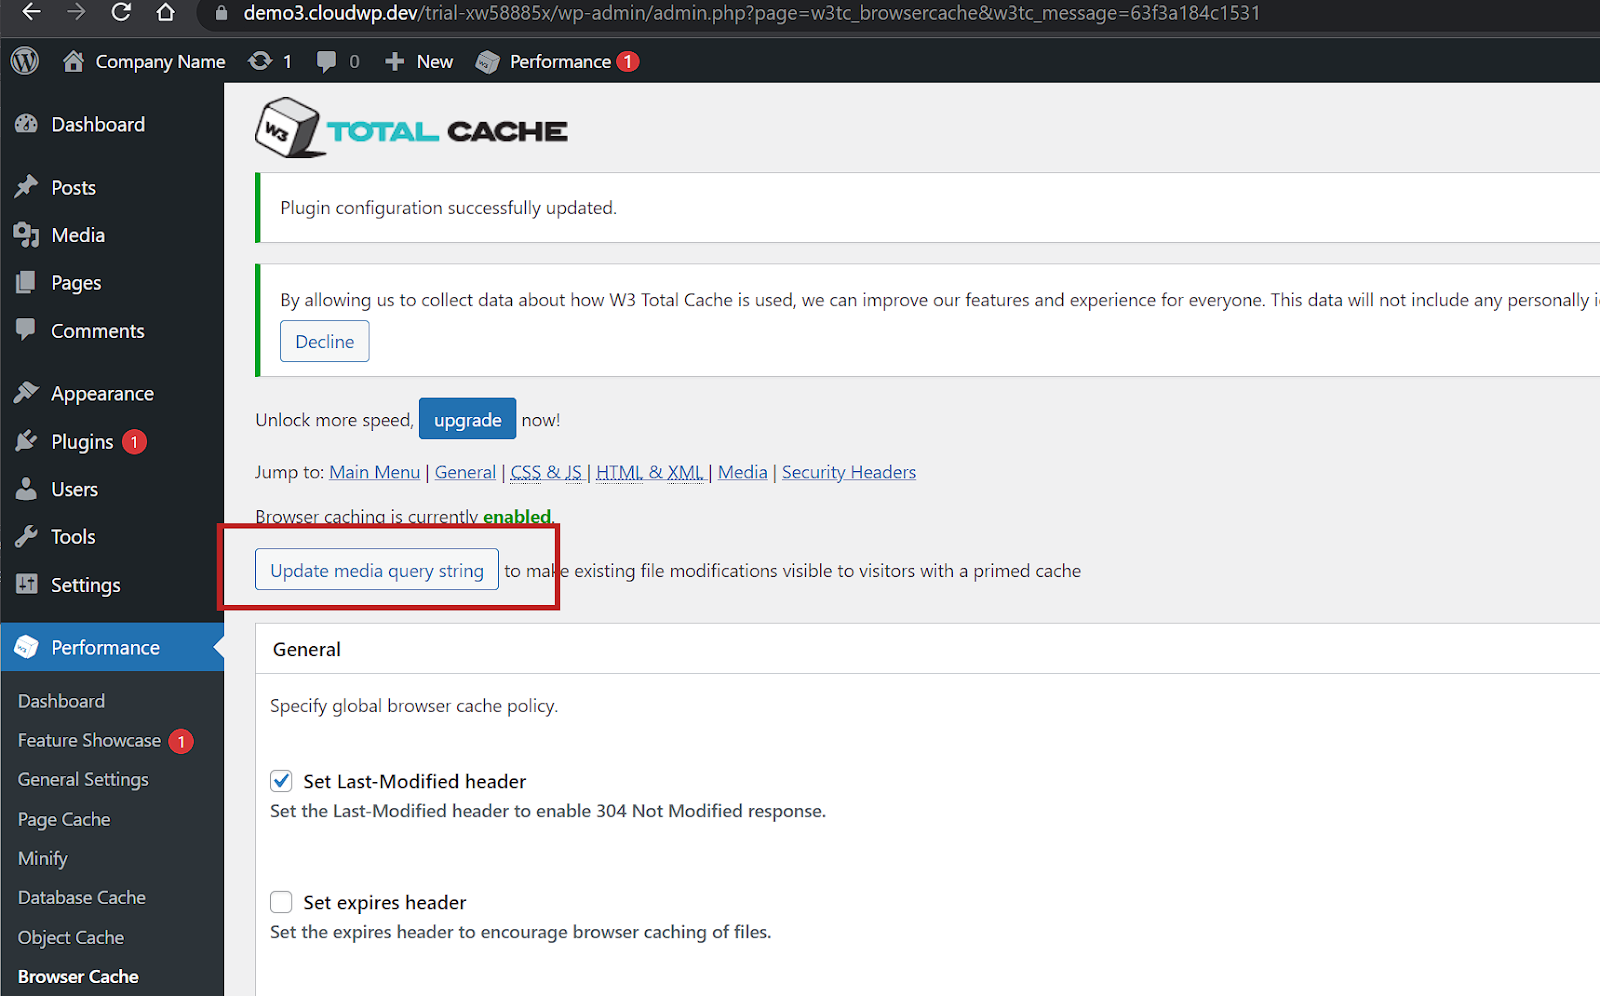
Whenever a change is made to a static asset, busting cache is done by navigating to the Browser Cache page under performance, and clicking “Update Media Query String” at top. This regenerates a new string that appends to the static asset URL, which will not match the URL of the stored version in your browser so it will show the updated version to the visitor.
Proxy Caching / CDNs
Cache storage is a finite resource, so every bit of storage performance matters. Caching at proxy servers is one of the ways to reduce the response time perceived by World Wide Web users.
- CDN level / edge caching
- Server (NGINX) Proxy Cache
- WordPress Plugins / Application level caching
Cache Eviction Policies
Cache replacement algorithms play a central role in reducing response times by selecting specific website assets for caching, so that a given performance metric is maximized. They do this by deciding which objects can stay and which objects should be evicted the next time the website is accessed.
- Least Recently Used (LRU): Replaces the cache line that has been in the cache the longest with no references to it.
- First-In First-Out (FICO): Replaces the cache line that has been in the cache the longest.
- Least Frequently Used (LFU): Replaces the cache line that has experienced the fewest references.
- Random: Pick a line at random from the candidate lines.
Caching Storage Engines
For the different types of caching and storage engines available in the W3TC plugin. The following list outlines those choices for you.
Note: In order for some of these services to be available to your WordPress installation, they must be installed on the server in conjunction with the PHP extension or module needed for the service to function.
Disk-Based Methods with W3 Total Cache
- Disk: Basic is the option that invokes a PHP script (advanced-cache.php) that does the hard caching job.
- Disk: Enhanced is the more efficient way of caching. This method does not invoke PHP scripts but solves the caching task in a much more elegant way by creating a static version of a web page and serves that instead of the dynamic version of your website via rewrites in the .htaccess file. This approach lets your web server deal with a static (cached) version of your web pages directly. Some tests reveal that the Enhanced method makes a website up to 2.5 times faster when compared to the Basic method.
RAM Based Methods with W3 Total Cache
- Memcached is a high-performance, distributed memory object caching system meant to speed up dynamic web applications by alleviating database load. It provides an in-memory key-value store for small chunks of arbitrary data (strings, objects) from the results of database calls, API calls, or page rendering.
- Memcached is ideal for relatively small and static data, and as a result may be more efficient than Redis in smaller data sets. It is also multi-threaded, which may be a benefit when using a VPS or Dedicated Server with a large resource pool.
- Redis is an open source (BSD licensed), in-memory data structure store, used as a database, cache and message broker. It supports data structures such as strings, hashes, lists, sets, sorted sets with range queries, bitmaps, hyperloglogs, geospatial indexes with radius queries and streams. Redis data structures resolve very complex programming problems with simple commands executed within the data store, reducing coding effort, increasing throughput, and reducing latency.
OPcode Based Methods with W3 Total Cache
- Alternative PHP Cache (APC / APCu) which provides in-memory Opcode caching and a key-value store for looking up cached items. This is largely deprecated in favor of modern Opcode Caching mechanisms, as APC is not supported in the PHP 7.x branch.
- APCu is similar to APC, though in order to support modern variants of PHP it is stripped of Opcode Caching and only provides the in-memory key-value store mechanisms. When paired with modern Opcode Caching mechanisms it can provide the functionality originally provided by APC, though it should only be used when you require having a limited cache size.
- eAccelerator is an in-memory Opcode caching solution that supports the PHP 4.x and 5.x major versions. This is largely deprecated in favor of modern Opcode Caching mechanisms, as eAccelerator is not supported in the PHP 7.x branch.
- XCache is an in-memory Opcode caching solution that supports up to the PHP 5.6 release. This is largely deprecated in favor of modern Opcode Caching mechanisms, as XCache is not supported in the PHP 7.x branch.
- WinCache (Recommended for Windows-based Environments) is an extension for Microsoft IIS which provides in-memory Opcode caching and currently supports up to IIS 10 as of 04/30/2019. Check the official Microsoft product page for the latest information.
Page Caching
Page caching refers to caching the content of a whole page on the server side. Later when the same page is requested again, its content will be served from the cache instead of regenerating it from scratch.
A page from a WordPress website contains dynamic content: PHP scripts, JavaScript, and SQL queries. Executing this dynamic content is very resource heavy and takes a lot of time. Page caching allows for forming a part of the web page into static HTML. With page cache enabled, website content displays faster for a visitor with less load to the server. It’s one of the most efficient ways to improve your website performance.
Tip: The Disk: Enhanced caching method is the recommended storage engine and the most reliable option for page caching for most types of hosting plans.
Disk: Enhanced is recommended because it allows the request to be redirected at the web server level, and the request does not have to use PHP. This allows the page cache to be served much faster, and is the ideal setup for using page cache.
Object Caching
Object caching is the process that involves storing database queries to serve a specific piece of data on the subsequent server request. As a result, there will be fewer queries sent to the database and the result is your website will load much faster.
WordPress Object Cache
The idea of an Object Cache is that WordPress Core, themes, and plugins may store some data that is frequently accessed and rarely changed in an object store. This is so these objects will not have to be retrieved and processed on each request.
wp_object_cache is WordPress’ class for caching data, and by default, the object cache is non-persistent. This means that data stored in the cache resides in memory only and only for the duration of the request. Cached data will not be stored persistently across page loads unless you install a persistent caching plugin.
Ultimately, Object Caching will reduce the total number of database queries required for each page load. When the CPU does not have to rebuild these blocks of data, your response time will decrease.
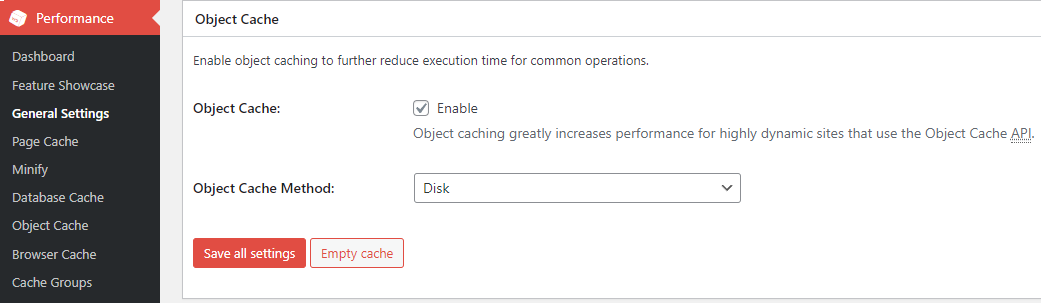
Tip: The Redis caching method is the recommended storage engine and the most reliable option for object caching if you have a VPS or Dedicated Server. For shared hosting, Disk may be your only option in some cases.
Store Transients in the Database with W3 Total Cache
Transients are the data that exists in memory (in cache) for current WordPress activity. It makes the website faster. However, when the cache is cleared or expires, the heavy numerous database requests should run again to re-fill the cache. In order to avoid these resource-intensive database requests, it’s recommended to save transient data into the database. It results in much less database load when the cache is cleared or expires.
In W3 Total Cache, there is an option to store transients in the database. This setting can be enabled in one of two areas: Object Caching Advanced Settings or by navigating to Performance > Object Cache.
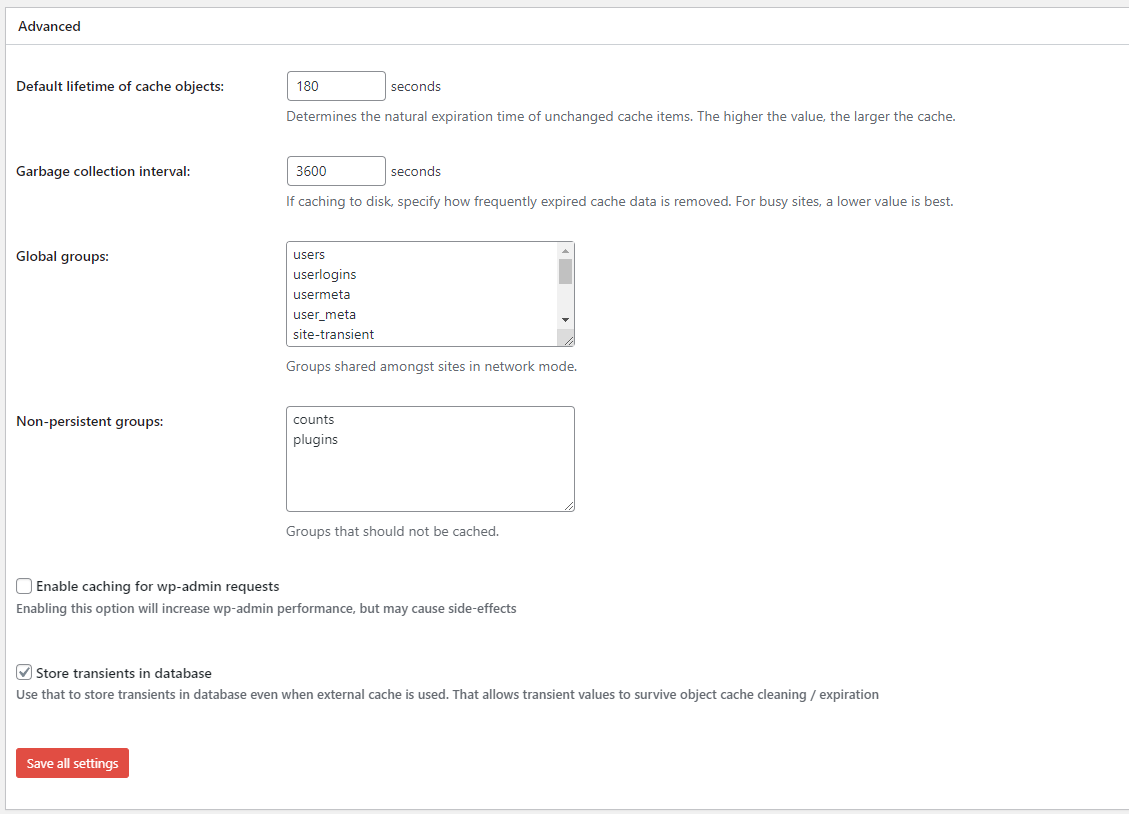
Database Caching
Database caching will store the results of MySQL database queries, in theory making it faster to return a response. While this does sound like it would be useful, it is recommended that you disable it, and use Object Cache via Redis or Memcache instead.
Tip: Database caching is not recommended if you are hosting on SSD or NVME drives.
Optimizing the WordPress Application
Once the server and database have been tuned for performance, the next step is to ensure the application is optimized for performance. This can be done by leveraging techniques designed to deliver assets more efficiently, or remove any unnecessary data from them resulting in faster transfers. The following are some of the most effective techniques you can use when it comes to optimizing your WordPress site for speed, but it is not an exhaustive list.
Top 10 Techniques to Improve Core Web Vitals for WordPress
When focusing on page and website performance, there are some essential tasks you can complete to help you achieve the performance results you are looking for. These tasks include configuring caching, following best practices for elements that can introduce layout shifts, and adjusting your assets to ensure they are configured for the fastest possible delivery to your visitors.
1. Page Caching
WordPress is a dynamic program by default, so the easiest way to speed things up is to create a static version of your website pages, and use redirects to serve those cached files instead of calculating the result again with PHP and MySQL. This cache can be stored on the disk, in the server’s RAM or if you are using a CDN, on a Point of Presence or Edge Server.
If you are storing the page cache on the web server, then it is recommended to use Disk: Enhanced storage, so the web server redirects can serve the cache prior to the request reaching PHP, essentially making the site load faster by using these static files instead of recreating them with queries and calculations.
Storing page cache on a CDN at the edge is a practice known as Full Site Delivery or Acceleration, where the website is served by sending a cached version of the website from a geographic location near the visitor, as opposed to the request reaching out to the origin server where the data lives. This removes location introduced latency from the equation, making websites much faster for all of your visitors.
2. Object Caching with Redis
By default, the object cache in WordPress is not persistent. This means that data stored in the cache resides in memory for the duration of the request and is removed after the response is delivered. To store these cached objects for reuse, you can use a plugin that connects the WordPress cache to Redis, a RAM based service that is used for persistent object storage.
W3 Total Cache will allow you to use object caching with Redis. Redis stores the data as keys in the web server’s memory, which allows for retrieval of the data to happen much faster than the WordPress method, which caches those objects to the options table in the database by default.
3. Leveraging Common UX Patterns
When adding elements such as fonts, carousels and banners to your website, you want to ensure you are following best practices. These types of elements can have a negative impact on Core Web Vitals if not implemented correctly.
A great example of this is not explicitly setting proper placeholders or dimensions for images, videos, iframes or other similar embedded content throughout your page. When the content is loaded, this can cause layout shift, and Core Web Vitals has very specific metrics, as a moving page can create a bad user experience for your visitor.
Loading custom fonts on your website is another example where things can go wrong. Adding them incorrectly can delay the text rendering or even cause layout shifts. Typically, your browser will delay displaying text until the font is loaded, which can also impact your FCP or LCP. If the text does load prior to your web font, and they are different sizes, layout shifts will occur and directly impact your CLS score.
Using best practices for these and other common UX elements is recommended to avoid negative impacts to your page performance.
4. Asset Minification
When developing a website, most programmers tend to use spacing and comments to make code readable for both themselves and others. Minification is a technique used to reduce load times on a website by removing unnecessary characters and comments from the code for faster delivery and rendering. This technique can be used on HTML, CSS and Javascript files and code, and can dramatically improve your site’s performance.
To minify your assets with W3 Total Cache, you will need to enable it in General Settings. There is an automatic mode which attempts to handle the heavy lifting for you, but if you have issues with it you will need to enable manual mode and add the assets you wish to be minified yourself under the minify page.
There is a help wizard for setting up minify, which you can use to specify the template to use when loading the asset, or choose to load the asset globally. Using this method you can create page templates and page specific assets that only load the necessary files for the page being requested to fine tune your application for performance.
5. Concatenation
The term concatenation refers to the action of linking things together in a series. In the context of website performance, this means combining multiple CSS and Javascript files into a few files, to deliver the assets the browser needs faster with less requests.
In W3 Total Cache, concatenating files is an option in General Settings, under minify. Checking the box will allow you to combine the asset files into one of 3 different files in the DOM: One in the head, one in the body or one at the footer before the closing of the document.
6. Eliminate Render Blocking Resources
Render-blocking resources is essentially code in your website files, usually CSS and JavaScript, that prevents a web page from loading quickly. To ensure your site loads as efficiently as possible, you can specify attributes that tell the browser how to download the code in relation to the other site assets.
When concatenating and minifying files using W3 Total Cache, you will also have the option of embedding them before the close of the document’s </head> tag, or after the <body> tag. To improve performance, you have the option of setting “rel” attributes for the assets such as async or defer, which will tell the browser when and how to load the file.
Using Minify with W3 Total Cache
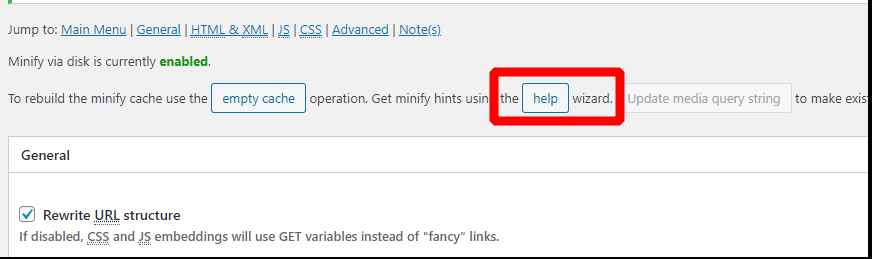
The Minify Help wizard in Total Cache will allow you to specify which JS and CSS files load by template, allowing you to have fine tune control over what assets load when and where. To use the wizard, you must set Minify to Manual Mode in General Settings, then visit the Minify Page to launch the Help Wizard.
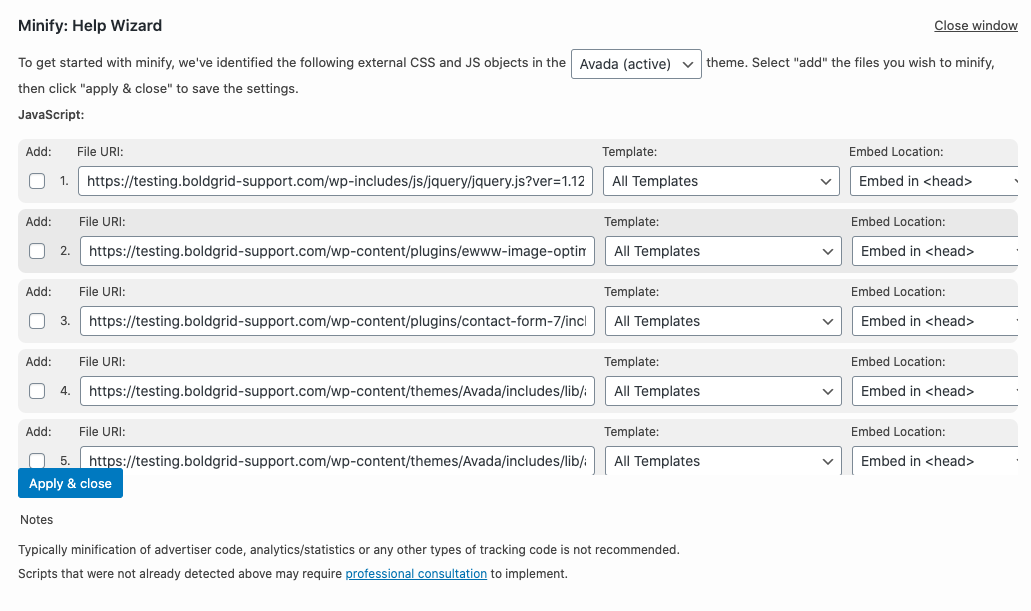
7. Preconnect & Prefetch DNS Hints
If your site is using multiple 3rd party scripts, the location those scripts are hosted on will be considered a cross-origin domain. That 3rd party domain will need to resolve to an IP address for the browser to download the file and complete the request.
The time it takes for this DNS resolution to take place can introduce latency into the page load, and using preconnect and prefetch will instruct the browser to handle this prior to fetching the asset. This can help remove the latency introduced by resolving a large number of DNS requests for assets in the background.
Using dns-prefetch and preconnect links will help your page load faster by performing these operations for later use. The dns-prefetch will do a DNS lookup, while preconnect will establish the connection to the server. This connection established will also include a TLS handshake, if served over HTTPS.
<link rel="preconnect" href="https://fonts.googleapis.com/" crossorigin />
<link rel="dns-prefetch" href="https://fonts.googleapis.com/" />
The preconnect hint should be used sparingly, and only for the most critical assets being used in the viewport during the initial page load. For non critical assets, using only the dns-prefetch hint is recommended.
8. Image Optimization
Image Optimization refers to the practice of a website delivering the highest quality image with the right format, resolution and dimensions for the device and viewport accessing them. This is done with the intent of keeping the file size as small as possible. There are several layers when dealing with optimizing your images, including removing metadata, converting to a different format, resizing and lazy loading.
Removing Image Metadata
One of the ways to reduce an image’s file size is to remove any metadata attached to the file. This data can include information about the camera used to take the picture, GPS coordinates, the files owner, comments, a thumbnail, date, description, keywords and much more.
There are several types of metadata that can be added to images, including EXIF, IPTC, XMP. Removing this data will help to decrease the file size of the image. An added benefit is that removing metadata keeps these details from being publicly shared.
Image Formats (WebP)
WebP is a compression format for images developed by Google. When optimizing your images for speed, using WebP is the recommended format for websites. Most modern browsers now support the WebP image format. There are many WordPress plugins that offer this type of image conversion and most even assist with redirects to automate the process and a fallback option in case the browser does not support the WebP format.
Dynamic Image Resizing
When different devices are used to access your web page, the image size needed will vary depending on the visitors viewport. Dynamic image sizes can be used to make each of these devices load the image with a size tailored specifically to the viewport where the site is being rendered.
A great example of this would be the hero image on your website. While a desktop would likely need the full size version of this image, the narrow viewport of a mobile device may only need an image that is 20% of that size. Providing the browser with the smaller size would reduce the time it needs to download the file, and display it.
There are many WordPress plugins and CDN Providers that offer dynamic resizing for images. The solution you choose should be based on your audience. If your visitors are mostly local and your traffic is not high volume, a CDN’s cost for this service may outweigh the benefits to you, so using a WordPress plugin may be your best option.
Lazy Loading Images
Lazy Loading is the practice of identifying non critical assets, and ensuring they only load later as needed to render the page in the browser. In the context of images, lazy loading is usually based on a user interaction such as scrolling, and loads the images needed as a user gets near them.
Lazy Loading allows the first render to happen faster, as it instructs the browser to only load the critical resources needed to display what is being rendered in the viewport. Then, as you scroll, the application can detect when resources (such as images or embeds are needed), and initialize the download.
W3 Total Cache offers lazy loading for images. And upgrading to Pro gives you the ability to lazy load Google maps.
9. Using Image Facades for Interactive Elements
One of the biggest issues authors run across is having multiple video embeds from providers such as Youtube or Vimeo. Loading these videos will force your site to do DNS lookups, make connections to these 3rd party servers in the background, and download the elements needed to render the content.
Providing an image that is served from your site’s domain as an interaction point to trigger loading these types of content embeds can save you precious time rendering your web page. It also saves the user from downloading Javascript and CSS for an element they are not going to use, as the video does not render unless the user specifically clicks on the image anchor link to trigger it.
This is also true for other interactive elements such as chat embeds or other interactive elements that are not hosted on your server and are being served to your visitor from a remote service.
10. Disable Plugins on Pages Where Not Needed
After you have optimized your site’s configuration, it is best practice to test your individual pages and disable any assets that are not needed on them. This can be done by using WordPress functions to deregister and dequeue any scripts or styles loaded by plugins not used, or there are some WordPress plugins that will help you do this from within the interface.
To accomplish this, you will need to measure each individual page and use the Network tab within the Inspector to determine what assets are loading per page. Once you have this information, you can determine if the assets are needed, or loading unnecessarily on a page.
This is a common issue with plugins that have front end output, and it can be easily remedied by identifying the pages where the asset is needed for the plugin to function, then using a WordPress function with conditional logic, to ensure those assets are only loaded on an “as needed” basis.
This example is for a plugin that is used on 3 pages – About Us, Contact and Management. Targeting any page that is not one of these by using a ! in front of the is_page conditional, we can use an if else statement to remove the scripts or styles. If this condition is not met, then normal operations would happen and the plugin assets would be included.
if ( !is_page( array( 'about-us', 'contact', 'management' ) ) ) {
// either in about us, contact, or management, do nothing
    } else {
    // Deregister scripts and styles
    wp_dequeue_style( 'handle' );
    we_dequeue_script( 'handle' );
}
You can also disable the entire plugin if it is not one of the pages in the array using the following code snippet that fires on the wp action hook.
function disable_plugin() {
if ( !is_page( array ( 'about-us', 'contact', 'management' ) ) ) {
deactivate_plugins('plugin/main-file-plugin.php');
     }
}
add_action('wp', 'disable_plugin');
Still Not Getting Your Desired Results?
When you have performed every optimization under the sun, and you are still not hitting the speeds you want to have, there is another option to pursue. Revisit your Theme choice.
When searching for a theme, opt for a lightweight and well-coded WordPress theme to ensure faster loading times. Avoid themes with excessive features and unneeded complex design elements that can slow down your site.
A lot of websites will have a custom theme developed specifically for their site’s purpose, which only includes the things their site needs. When performance is a goal you are chasing, you can get exactly what you need by building your WordPress theme from the ground up, as opposed to the included kitchen sink approach that you get with a lot of commercial themes.
Server Monitoring & Adjusting Performance
Ensuring optimal performance for your server and WordPress website is crucial for providing a smooth and responsive user experience. However, performance can degrade over time due to changes in content and application.
In this section, we will explore the importance of monitoring and adjustment strategies to maintain peak performance. We will delve into key areas such as memory usage on the server, caching statistics review, periodic performance testing, analytics, and uptime monitoring. Let’s dive in!
Monitoring Regimen for Continuous Performance
To maintain performance over time, it’s essential to establish a monitoring regimen. Regularly monitor and track performance metrics while considering content and application changes. By doing so, you can identify potential bottlenecks and take proactive measures to optimize performance.
Memory Usage on the Server
One critical aspect of server performance is memory usage. Keep a close eye on memory allocation and usage, particularly concerning Redis. Monitor eviction history and adjust the allocation as needed to ensure efficient memory utilization.
Adjusting Database Buffers
As your database grows, the buffers may need adjustment to optimize memory allocation. Run a MySQL tuning script to evaluate database usage and receive optimization suggestions for improving your my.cnf configuration file. By fine-tuning your database, you can enhance overall server performance.
Managing FPM/OPcache Memory Consumption
FPM and OPcache play vital roles in PHP performance. Monitor their memory consumption and usage patterns. Utilize dashboards or command-line tools like those provided by OPcache Dashboard and PHP Performance Control Panels to gain insights. Based on your findings, adjust pool settings to ensure optimal performance.
Caching Statistics Review
Caching plays a crucial role in improving website performance. Examine cache hit rates versus misses to determine if any adjustments are necessary. Analyze CDN cache and edge hit rates against the origin server. Evaluate cache control headers and NGINX proxy caching configurations to optimize caching effectiveness.
Application and Server Caching Statistics
Utilize powerful caching plugins like W3 Total Cache to leverage page caching, minification, fragment cache, and exclusions. Regularly review caching statistics provided by these plugins to gain an overview of their performance impact. Consider adjustments based on the insights gained.
Periodic Performance Testing
Periodic performance testing is essential to evaluate the overall performance of your website. Use tools like PageSpeed Insights, Lighthouse, GTMetrix, and Pingdom to gain comprehensive insights into your website’s performance. By conducting regular tests, you can identify areas for improvement and optimize your site accordingly.
Google Analytics for User and Page Experience
Leverage Google Analytics to gain valuable data on user and page experience. Monitor the geolocation of your users and assess if your content is adequately distributed to provide optimal performance. Analyze metrics related to Page Experience and Core Web Vitals to pinpoint any areas requiring attention.
Uptime Monitoring
Maintaining high uptime is critical for ensuring a seamless user experience. Implement uptime monitoring using tools like Uptime Robot, Pingdom, or other suitable options. Look for services that offer notifications to alert you promptly in case of downtime. Regularly review uptime statistics to identify potential issues and take appropriate actions.
Adjusting Based on Monitoring Results
To achieve optimal performance, review resource usage against available resources. Assess your server specifications in comparison to your specific needs. Based on your monitoring results, determine whether scaling horizontally or vertically is the best approach for improving performance. We’ll outline some situations where more RAM or CPU may be required.
Monitoring and adjusting performance on your server and WordPress website are continuous processes that demand vigilance. By establishing a comprehensive monitoring regimen, reviewing caching statistics, conducting periodic performance testing, leveraging analytics, and ensuring uptime, you can maintain a high-performance website.
Regular adjustments based on monitoring results will allow you to optimize resource utilization and deliver an exceptional user experience. Remember to consider the specific needs of your website and the demands of your audience. By continually fine-tuning your server, caching mechanisms, and database configurations, you can ensure that your website performs at its best, even as it evolves and grows.
Stay proactive, stay vigilant, and let performance optimization be an ongoing priority for your server and WordPress website. With these strategies in place, you can keep your digital presence running smoothly and provide visitors with a fast, responsive, and enjoyable online experience.
Monitoring & Performance Resources:
- Top Monitoring Plugins for WordPress
- How to Create a Website Stress Testing Plan
- How to Stress Test Your Website / Top 3 Load Testing Tools
Experience High-Performance WordPress
Sign Up for your Platform InMotion account today and experience the best performance possible for your high-traffic WordPress site! See how InMotion’s fully-isolated servers offer 40x faster WordPress hosting speeds with dedicated resources, server caching profiles, and optimization tools. Improve Core Web Vital scores with NVMe, Redis, and UltraStack. All on high-availability servers with 99.99% uptime.
About the Authors
Carrie Smaha, Senior Manager Marketing Operations
Carrie Smaha is a seasoned professional with a laser focus on Go-To-Market programs and cutting-edge SaaS solutions within the realm of Cloud WordPress Hosting. With an impressive two-decade journey encompassing IT project management, digital marketing, and web development, Carrie’s passion for all things digital is evident in everything she does.
Drawing from her extensive programming background, Carrie excels in troubleshooting and addressing technical needs for customers. She not only tackles challenges head-on but also takes the lead in identifying strategic marketing opportunities and seamlessly integrating solutions that drive results.
Carrie’s commitment to providing top-notch client services and marketing solutions is underpinned by her deep understanding of customer insights and industry dynamics. Her meticulous and detail-oriented approach ensures that she delivers exceptional value to clients on a daily basis.
One of Carrie’s true joys is working on demand generation and product marketing initiatives. She thrives on crafting multi-touch campaign designs, optimizing technical SEO, creating impactful content marketing strategies, contributing to software design, and streamlining business operations.
In essence, Carrie Smaha’s expertise, coupled with her genuine enthusiasm for digital innovation, makes her an invaluable asset in Go-To-Market strategies and SaaS solutions for Cloud WordPress Hosting.
Harry Jackson, Product Manager
Harry Jackson is an accomplished Product Manager with 15 years in WordPress, boasting a diverse skill set that goes beyond product development. He excels in innovative product creation, business development, content delivery networks (CDNs), and enhancing InMotion Hosting’s SaaS solutions by extending WordPress features.
Throughout his career, Harry has consistently driven innovation, leading transformative product initiatives and navigating development to empower digital experiences. His deep industry insight, coupled with a passion for WordPress, positions him as a leader in shaping exceptional solutions that tackle challenges and enhance user engagement.
Harry’s strategic business approach, combined with technical server knowledge, allows him to create holistic solutions driving business growth while ensuring seamless products for InMotion’s customers. His ability to tailor WordPress features for InMotion’s SaaS solutions gives him a unique edge.
As WordPress evolves, Harry’s commitment to revolutionizing digital experiences through strategic insight, relentless creativity, and passion for product excellence remains unwavering. His illustrious history and desire for innovation drive his excitement to shape WordPress-driven solutions and positively impact our customers. Harry’s expertise in business development, website performance, and feature extension is pivotal for InMotion Hosting’s SaaS offerings. His holistic product management approach and multifaceted skills make him a valuable asset in the world of web hosting and open-source solutions.