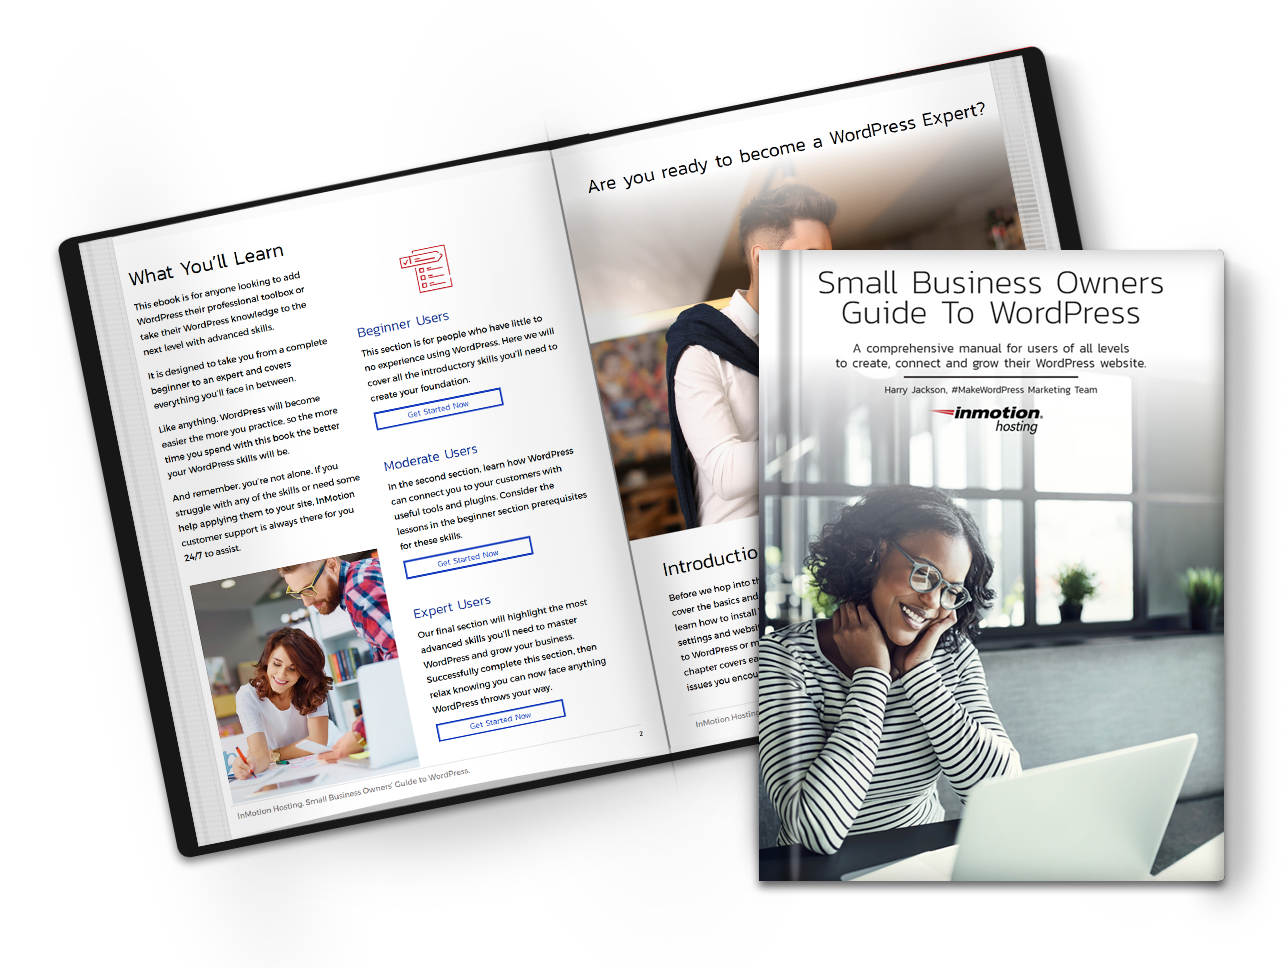
When operating a WordPress site with multiple users, it can be difficult to identify potential sources of bugs and errors. Using a plugin such as WP Debugging automatically enables your WordPress site to display helpful error messages and bug codes. With this information you can more easily troubleshoot your website and resolve issues. In this article we will provide a brief description of key features of the WP Debugging plugin and provide basic instructions for its use.
Topics include:
Enabling WordPress Errors
No matter how well a website is designed, it is always possible for errors and bugs to appear. Sometimes this can result from installing a new plugin or theme, or sometimes it can be an issue with the database or scripts being used for the site. To help troubleshoot these issues, a technique known as debugging can identify the cause of errors and guide you to a solution.
As mentioned previously, installing WP Debugging and activating the plugin immediately enables the following error logging features:
WP_DEBUG_LOG – When set to true, this feature enables logging of WordPress errors.
SCRIPT_DEBUG – When set to true, this feature will debug any scripts that are being run on the site, such as those used by WordPress plugins or themes.
SAVEQUERIES – When set to true, this feature saves all site queries to help identify which queries lead to errors.
In order to activate these features, WP Debugging automatically updates the wp-config.php file to set the above values from false to true. While this same action can be performed manually, using WP debugging does it for you. Additionally, the plugin preserves the original settings, so when WP debugging is deactivated, the settings will revert to their original values. This is useful if you need to quickly check a page of your site for errors but don’t want unsightly error messages to clutter your publicly visible web pages in the long term.
Add-On Plugin Compatible
WP debugging also supports integration with the query bar and query monitor plugins, which add more functionality for debugging and troubleshooting. The query monitor plugin allows you to troubleshoot database queries and PHP errors. The debug bar plugin adds debugging options directly to the WordPress admin bar, making it easy to debug individual pages rapidly.
Modifying WP Debugging Settings
While WP Debugging automatically updates the wp-config.php file to enable error logging, there are a few settings you can customize. Please note that the wp-config.php file needs to be writable by the system so it can perform the necessary automatic modifications.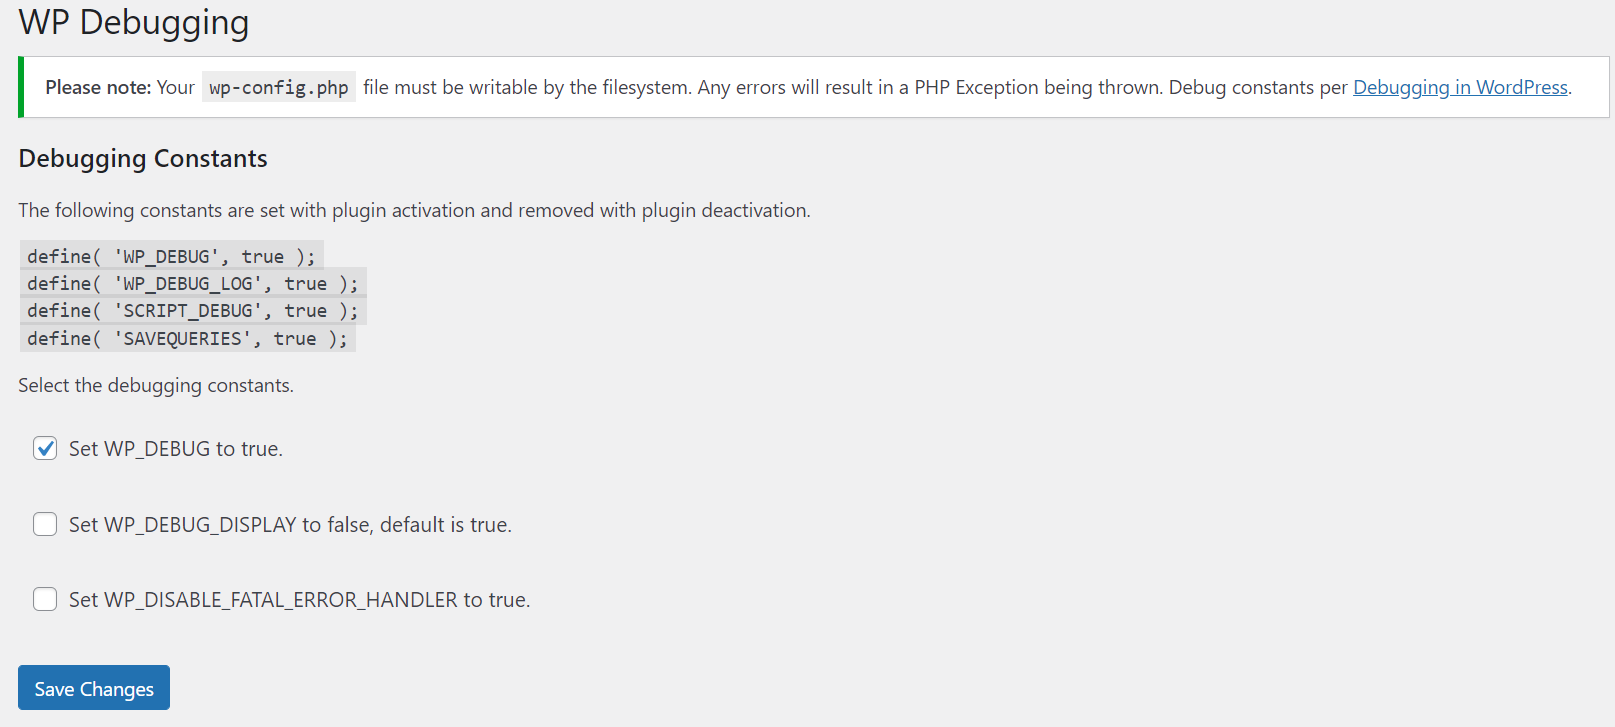
- First, log into your WordPress dashboard.
- Next, navigate to Tools > WP Debugging.
- On the next page you will see a section labeled Debugging Constants. To modify these settings, please review the following options:
SetWP_DEBUGto true – Enables debugging.
SetWP_DEBUG_DISPLAYto false – Enables the display of error messages. - Once done, click Save Changes.
Congratulations, you now know how to modify WP Debugging settings.
Next Steps
To help you better organize your WordPress site and avoid potential errors, consider installing a user management plugin to help you manage various user roles and permissions.
Improve the performance and security of your WordPress website with our new WordPress VPS Hosting plans. Get 40x faster speeds with dedicated resources, server caching, and optimization tools.
![]() High-Performance VPS
High-Performance VPS ![]() 99.99% Uptime
99.99% Uptime ![]() Free SSL & Dedicated IP
Free SSL & Dedicated IP ![]() Advanced Server Caching
Advanced Server Caching