Welcome to our Working with People Stats course. We begin by giving an introduction to the stats report dashboard. PrestaShop provides a statistics area that offers a lot of information about your store that is collected, tracked, and sorted. This is a large page with three distinct areas. These are broken down into navigation, settings, and content panel, which is the right side of the page. This article will walk you through the layout and give you a basic understanding of the main stats dashboard page.
Stats page introduction for PrestaShop 1.5
Getting to the Stats page
1. Log into the PrestaShop 1.5 admin dashboard.
2. Using the top menu bar, hover over the Stats tab and click on the Stats option.
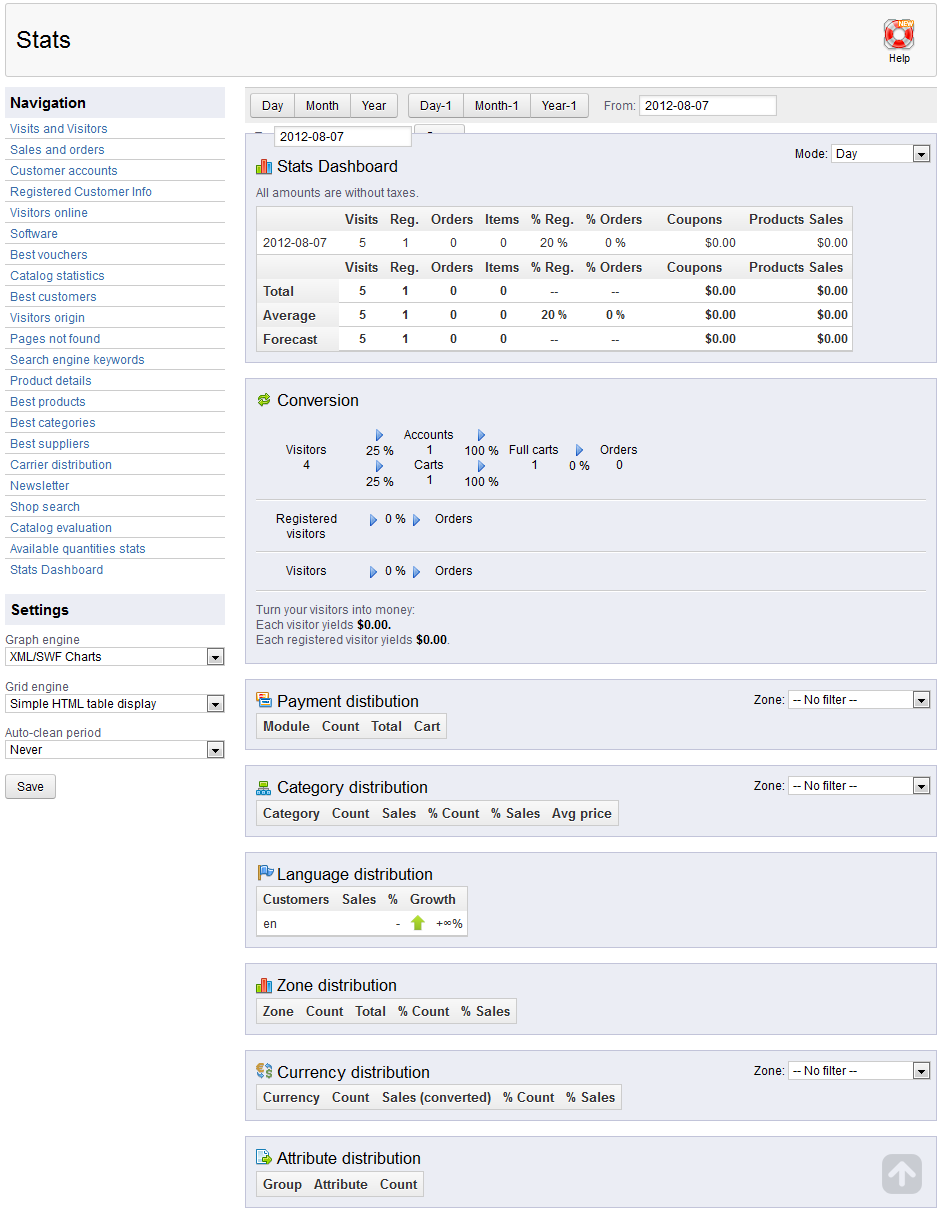
Stats Dashboard
The left sidebar is home to the Navigation section of the page. Here you will see many links to many different stat reports. Clicking on one of these links will change the display in the right hand panel of the screen. When initially landing on the Stats page, the last selection, Stats Dashboard, is displayed by default. The dashboard has three basic areas.
The topmost bar contains filter settings so you can get results based on the date range you prefer. The results are displayed in the table just below it.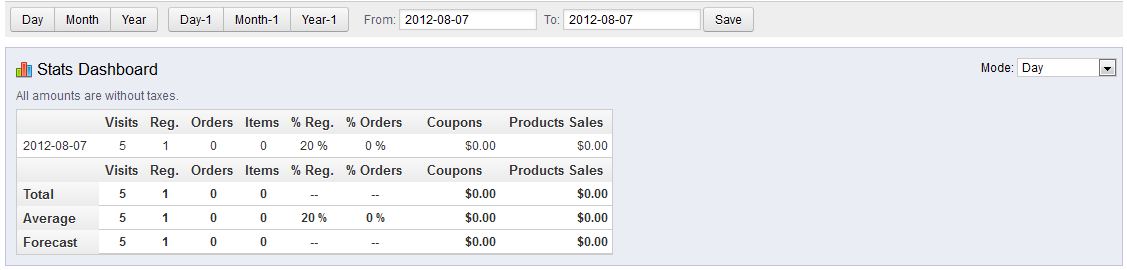
The conversion section is the area that displays the visitors, their orders, and the amount of money each customer has produced.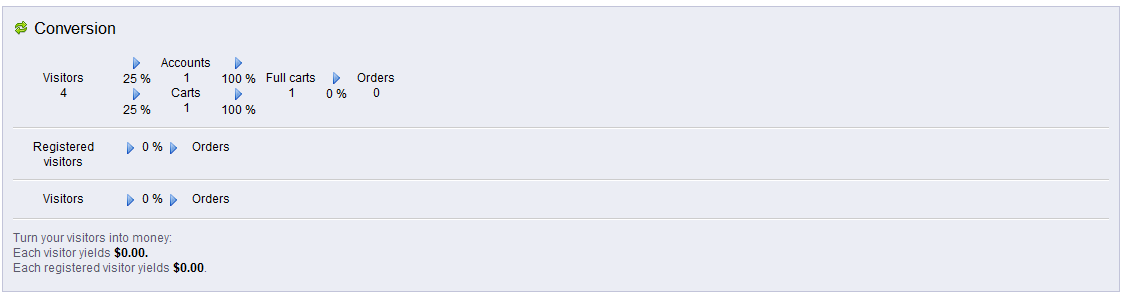
The lower section is the distribution section. There are several subsections here such as Payment, Category. Language, Zone, Currency, and Attribute. This will break down the statistics based on each subcategory.
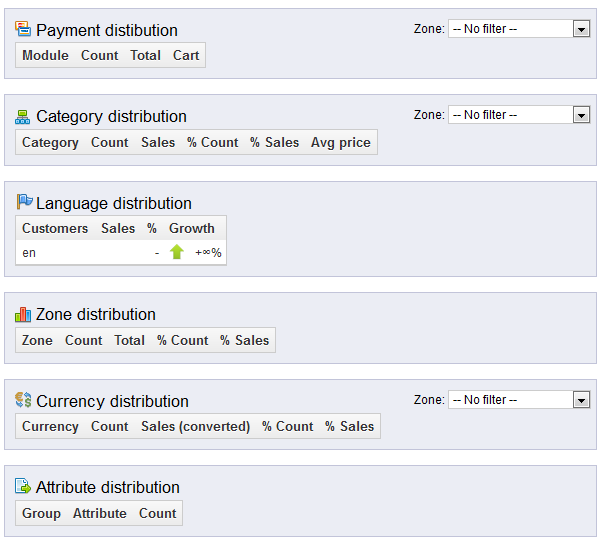
Additionally, you can further filter the Payment, Category, and Currency distributions by the following default zones:
| Africa |
| Asia |
| Central America/Antilla |
| Europe |
| Europe (outside of E.U.) |
| North America |
| Oceania |
| South America |
Settings
The lower section on the left hand sidebar is the Settings section. This area does not change the statistics, just the way they are displayed on the page.
| Graph Engine | choose which graph engine to display the charts |
|---|---|
| Grid Engine | choose which graph engine to display the charts |
| Auto-clean period | the time period where Prestashop will delete the data |
Note that the Grid Engine setting only contains one option by default. Additional options can be added via modules.
This concludes a brief overview of the Stats page layout. Be sure to check out our other articles with more detailed information on the different types of statistics, such as our Visits and Visitors report.