
It’s no secret that infographics have become a big craze for the past couple of years. More and more people want visual presentations of complex information that are enjoyable and easy to digest.
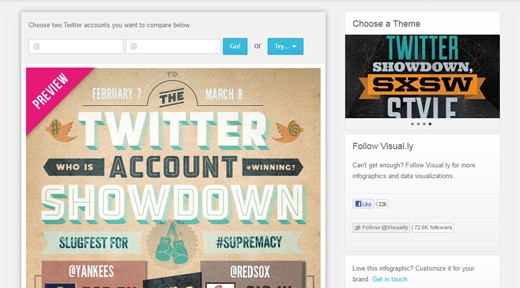
To accommodate this thirst for fun information, Visual.ly has developed a new platform that allows you to effortlessly create your own data visualizations. You simply browse a gallery of templates and themes, and select one to customize and tweak. Not only is it designed for you, but it draws in data such as demographics and statistics for you from Facebook and Twitter too.
Because infographics are becoming more valuable and desirable, prices for them are going up as well, so this tool ends up being a great alternative for those who need a quick and easy graphic. It’s a free service to everyone, and companies can even connect with any of the designers who contribute to the website. Premium accounts, which they charge for, are also available for those who wish to have something a lot more specific designed for them. They simply reach out to one of the designers to provide that special attention.
Visual.ly will be adding more datasets to pull from in the future, so there will be no need to only rely on Facebook and Twitter. There will also be a lot more modifiable themes and graphics to choose from in the next few months.