Our previous article taught you about the Best Suppliers. This next article in our Working With Product Stats course explains the Carrier Distribution report. It is actually a very simple report showing the percentage ratios of your different carriers.
Accessing the Carrier Distribution report in PrestaShop 1.5
- Log into your PrestaShop 1.5 admin dashboard.
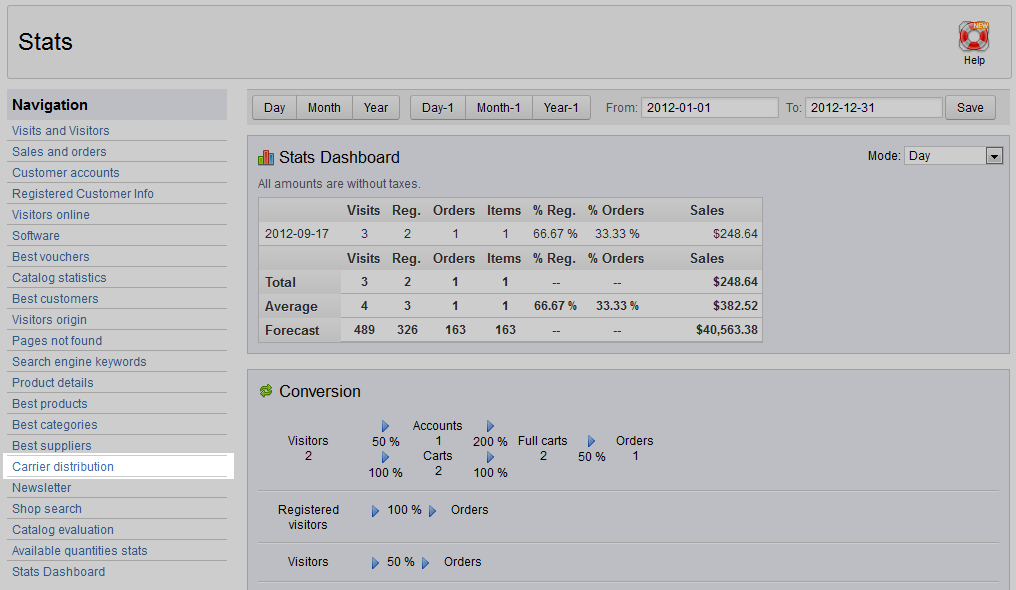
- Using the top menu bar, hover over the Stats tab and click on the Stats option.
- This will bring you to the Stats page. On the left hand sidebar are the many stats reports. Click on the Carrier Distribution link.
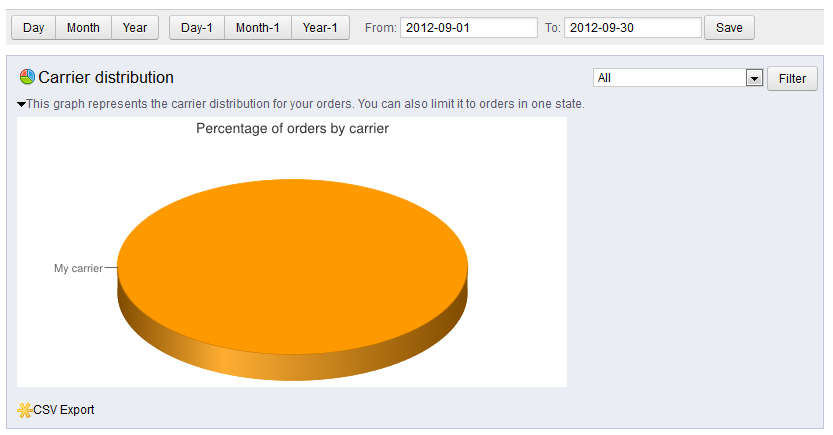
- The Carrier Distribution report is a very simple report. It contains a pie chart that displays the breakdown of your different carriers. In our sample here, you can see we have only used one carrier, therefore the chart shows at 100%. This can be very common if you are working within a limited area. If you work in a larger area, or even internationally, you may have many carriers represented.
Continue with our product report series. In our next article, we will go over the Shop Search report.

