As a Magento hosting provider with Magento 1.6, InMotion Hosting offers a convenient built-in feature to assist you in troubleshooting memory-related problems. By activating the Debug Profiler, a small link displaying relevant information about the current memory usage will be added at the bottom of every page. Enabling the Debug Profiler is a simple process that can be accomplished within the Magento 1.6 Admin Panel.
- Log into your Magento Admin Backend
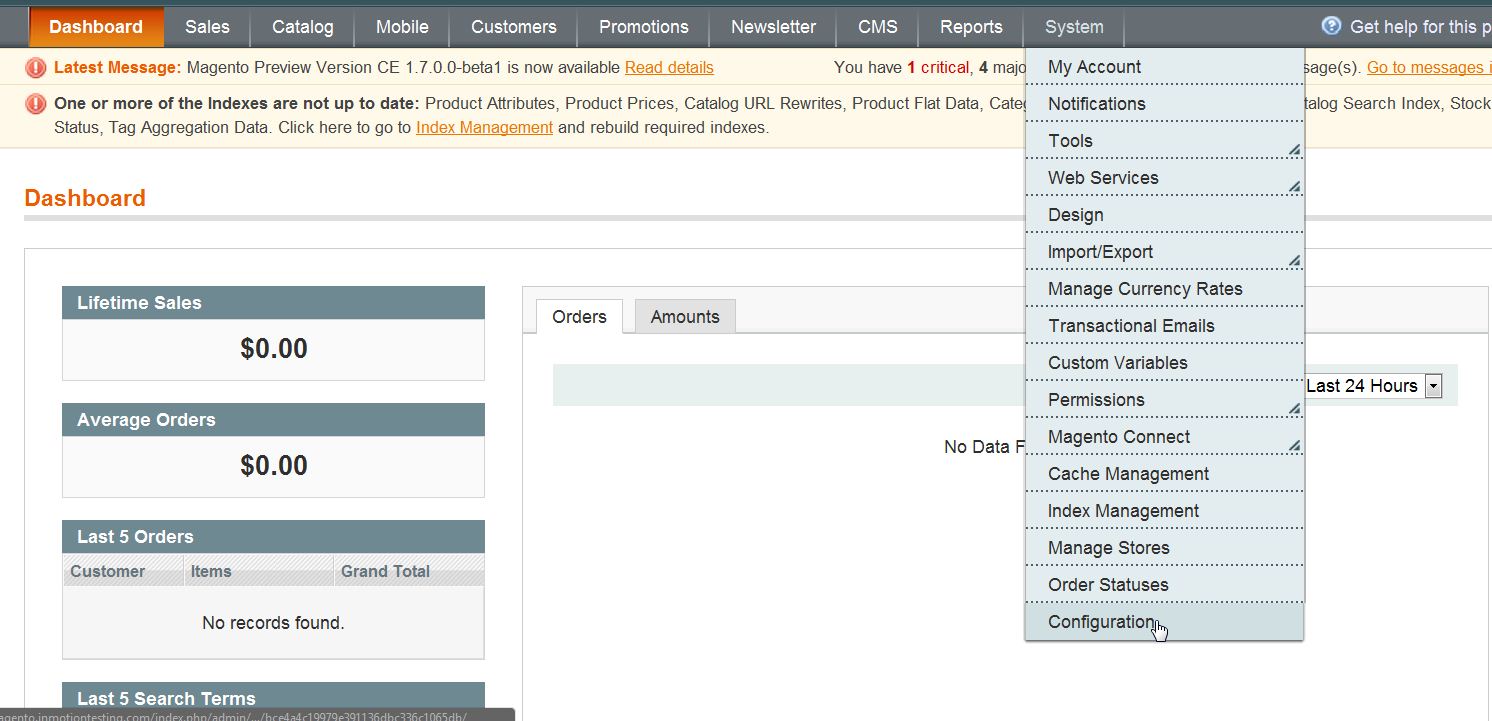
- Go to System ->> Configuration
- Click on “Developer” in the left side menu pane
- Open the “Debug” section
- Change the “Profiler” to “Yes“
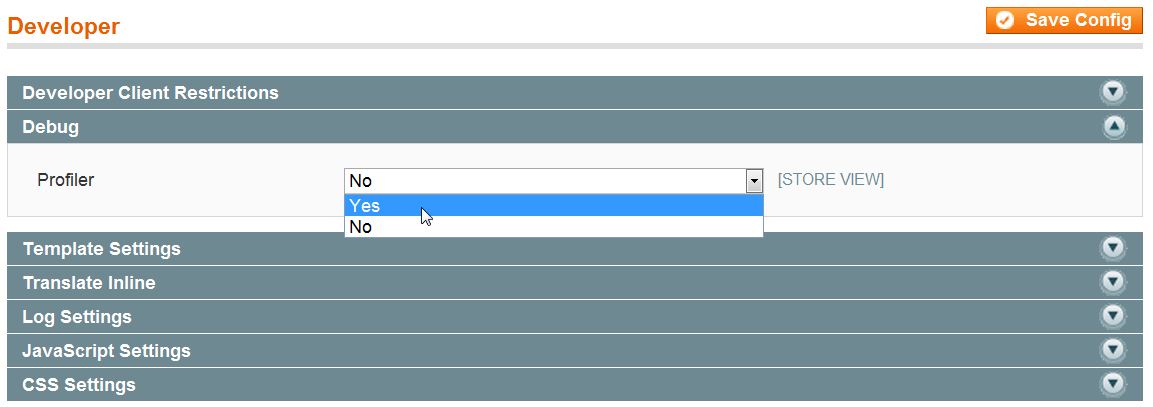
- Click “Save Config“
Now when you visit your website frontend, you’ll see the memory usage details at the bottom of the page below the footer.

If you need further assistance please feel free to ask a question on our support center.